Our Work

DigitalXScale

Research

Data Visualization

Web Development

Interface Designs

Web Applications

react.js

next.js

adonis.js

DigitalXScale | Wheeler Institute for Business and Development | Craftnotion

Research Platform for the Wheeler Institute at London Business School — Custom CMS and Excel-to-Infographic Tool

The Wheeler Institute for Business and Development is the research wing of London Business School focused on how business and technology can drive global development. Their DigitalXScale initiative tracks and analyses the fintech sector in Africa — a database covering hundreds of firms, the research behind it, and the data story that makes it legible to a global audience.

They needed a platform to publish that research: papers, reports, data visualisations, and media. What made this project technically demanding wasn't the content — it was the requirement that the research team be able to manage everything themselves, including generating infographics directly from their own Excel data without involving a developer or designer.

We built DigitalXScale in two phases: Phase 1 — the core research platform, custom CMS, and content architecture — delivered in 2 months for $6,000. Phase 2 — the Excel-to-infographic tool and extended data features — delivered in 3 months for $6,500. Total: 5 months, $12,500.

DigitalXScale research platform for London Business School Wheeler Institute | Craftnotion

What the Client Needed

A university research programme has different digital requirements than a business. The platform needed to handle academic content — research papers, reports, datasets, and media — and make it accessible to researchers, policymakers, and global stakeholders without requiring a technical intermediary every time something needed publishing or updating.

Two requirements stood out. First, a CMS that the Wheeler Institute's research team could operate fully on their own: add papers, update data, publish reports, and manage the platform without going back to a developer. Second, the ability to generate data visualisations directly from their own spreadsheets. The research team works in Excel. The platform had to accept their raw data and turn it into published charts and infographics — with no design or development resources required from their end.

DigitalXScale research content and infographic sections | Craftnotion

How We Built It

We built DigitalXScale on Next.js for the frontend, Node.js for the backend, and PostgreSQL as the database. Critically, we built the CMS entirely from scratch — no off-the-shelf solution like WordPress or Strapi. The research team's workflow and content model required a system designed around how they actually work, not around a general-purpose CMS that they'd have to adapt.

Research Repository and Content Architecture

The platform organises research by topic, geography, and publication type — papers, reports, datasets, and media resources all live in a structured repository with filtering and search. For a research initiative covering a fast-moving sector like African fintech, the ability to surface relevant content quickly is as important as the content itself. We structured the data model in PostgreSQL to support the complex taxonomy the Wheeler Institute's research required.

DigitalXScale research repository and content architecture | Craftnotion

Custom CMS Built from Scratch

We built a full content management system tailored to the Wheeler Institute's workflow. The research team can log in and manage the entire platform independently: add new papers and reports, update existing content, publish media, and manage the research taxonomy. No developer involvement required for day-to-day content operations. For an academic institution that publishes continuously, this independence is essential — waiting for a developer to post a new research paper isn't a workable model.

Building from scratch rather than using an existing CMS gave us the ability to model the content exactly as the Wheeler Institute's research is structured, rather than shoehorning academic research workflows into a system designed for blog posts or product catalogues.

DigitalXScale custom CMS for Wheeler Institute research management | Craftnotion

Excel-to-Infographic Tool

This is the feature that made the project technically distinct. The Wheeler Institute's research team works in Excel — their data lives in spreadsheets. The platform includes a tool that lets a researcher upload an Excel file, select the type of chart or visualisation they want (bar, line, pie, map, and so on), and generate a publishable infographic directly on the platform. No design software, no developer involvement, no exporting to a third-party tool and importing back.

The result is that the research team can go from raw data to a published data visualisation entirely within the platform. For a team whose job is producing and communicating research — not managing software — this removes a significant friction point from the publication workflow.

DigitalXScale Excel to infographic tool — upload spreadsheet, generate chart | Craftnotion

Media, Events, and Research Updates

Beyond the research repository, the platform manages media resources — videos, podcasts, event recordings — and keeps the research community informed about ongoing and upcoming Wheeler Institute initiatives. All of it managed through the same custom CMS, giving the team one system for the entire platform rather than multiple disconnected tools.

DigitalXScale media and events section | Craftnotion

Results

The Wheeler Institute has a research platform they operate entirely on their own — publishing papers, updating data, and generating infographics from their Excel files without developer or designer involvement at any step. The custom CMS, the data architecture, and the Excel-to-visualisation tool collectively give a research team the ability to move at research pace, not at development pace. Delivered across two phases totalling 5 months and $12,500.

DigitalXScale platform results — Wheeler Institute fintech Africa research | Craftnotion

Research Platform and Academic Website Development — Common Questions

What features should a university research platform website have?

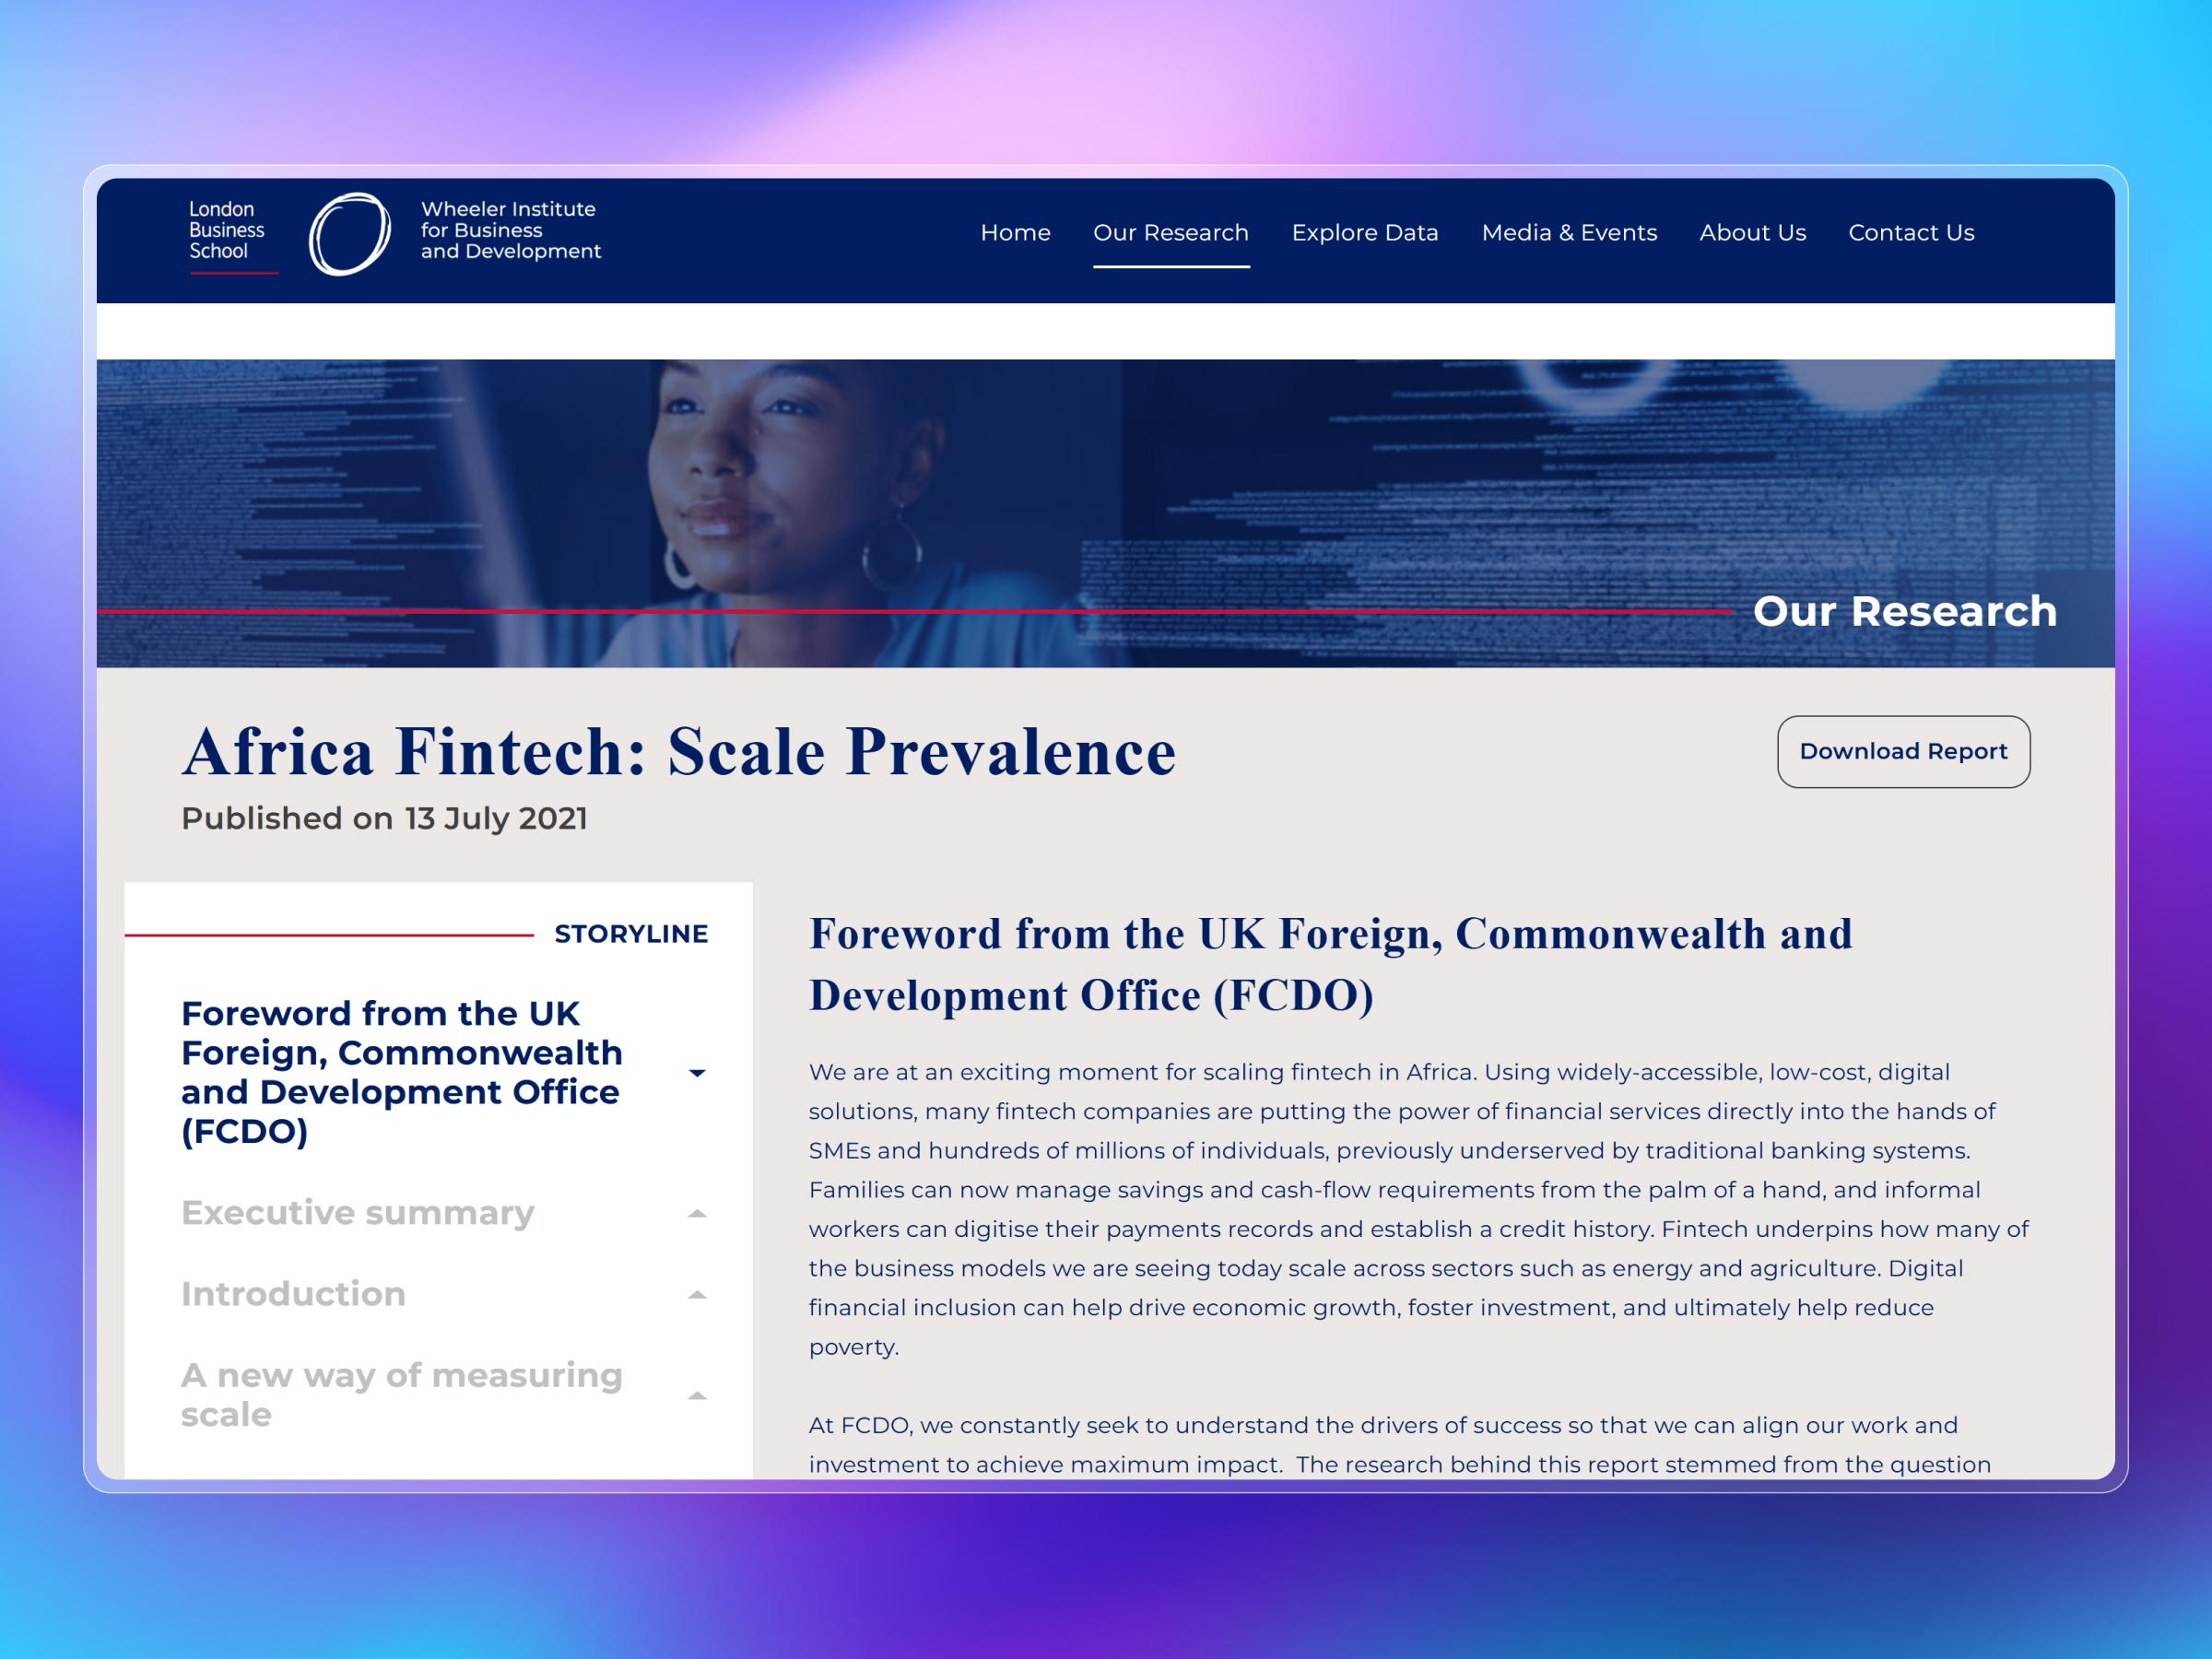
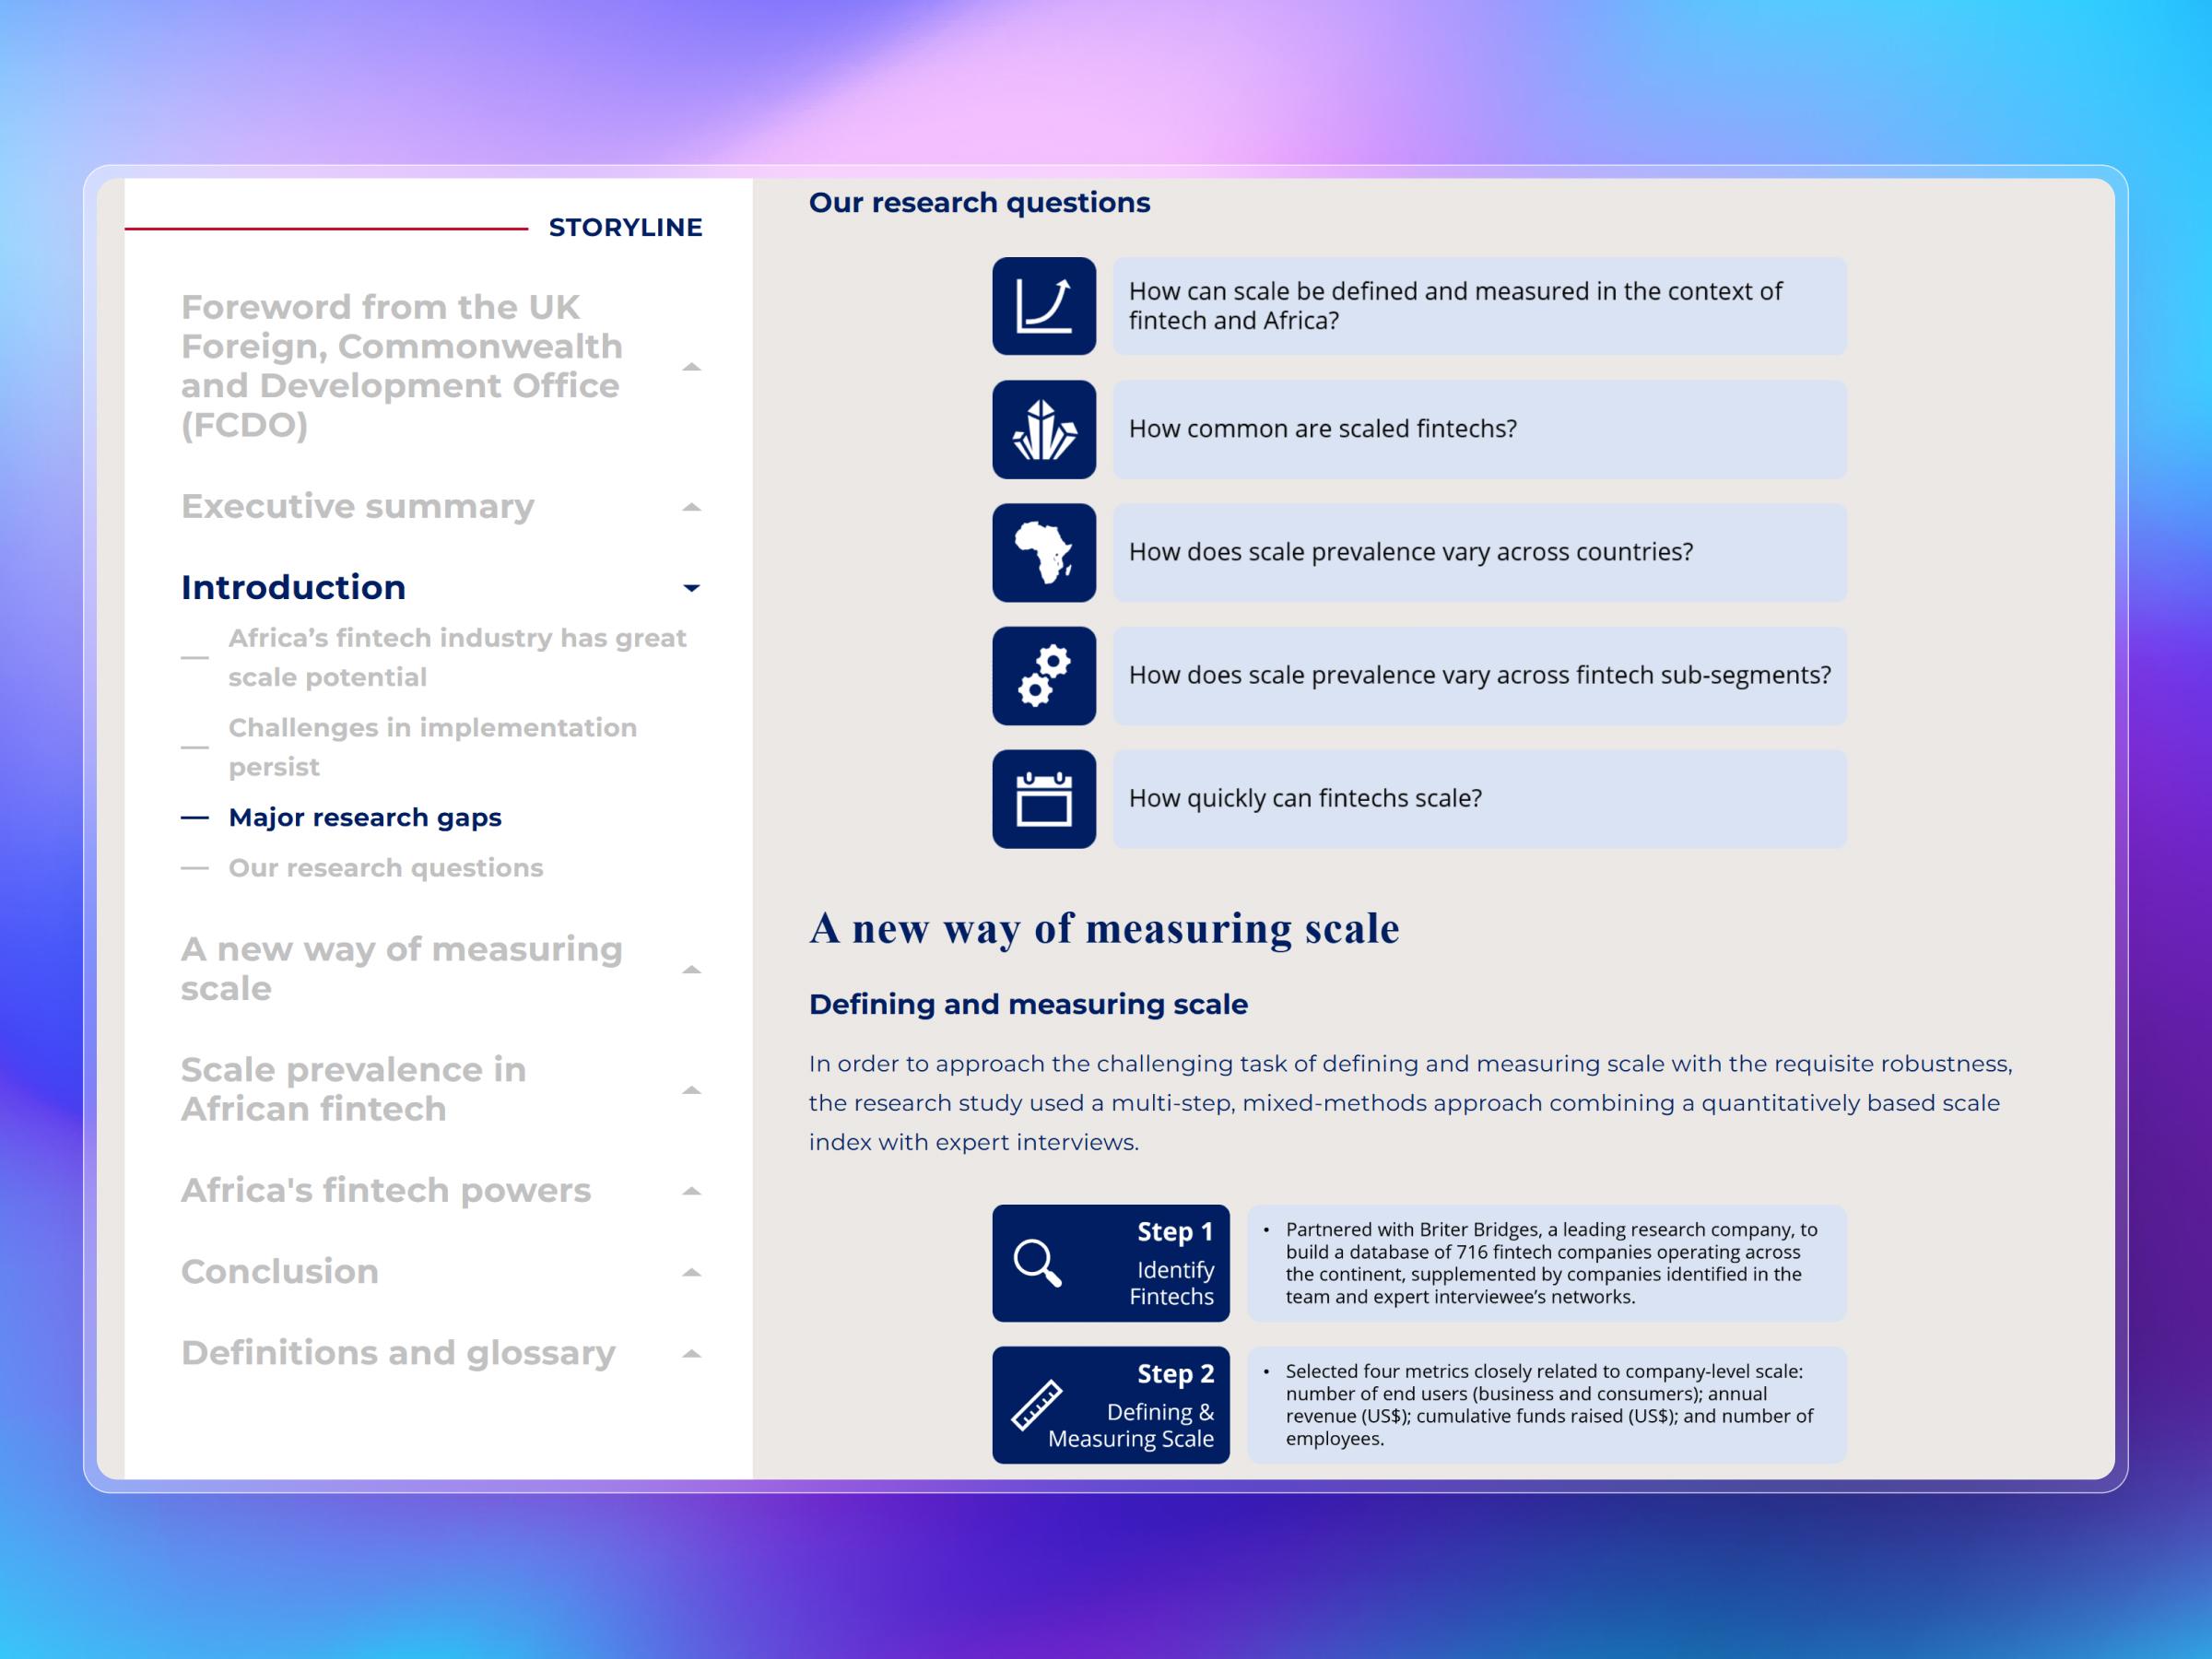
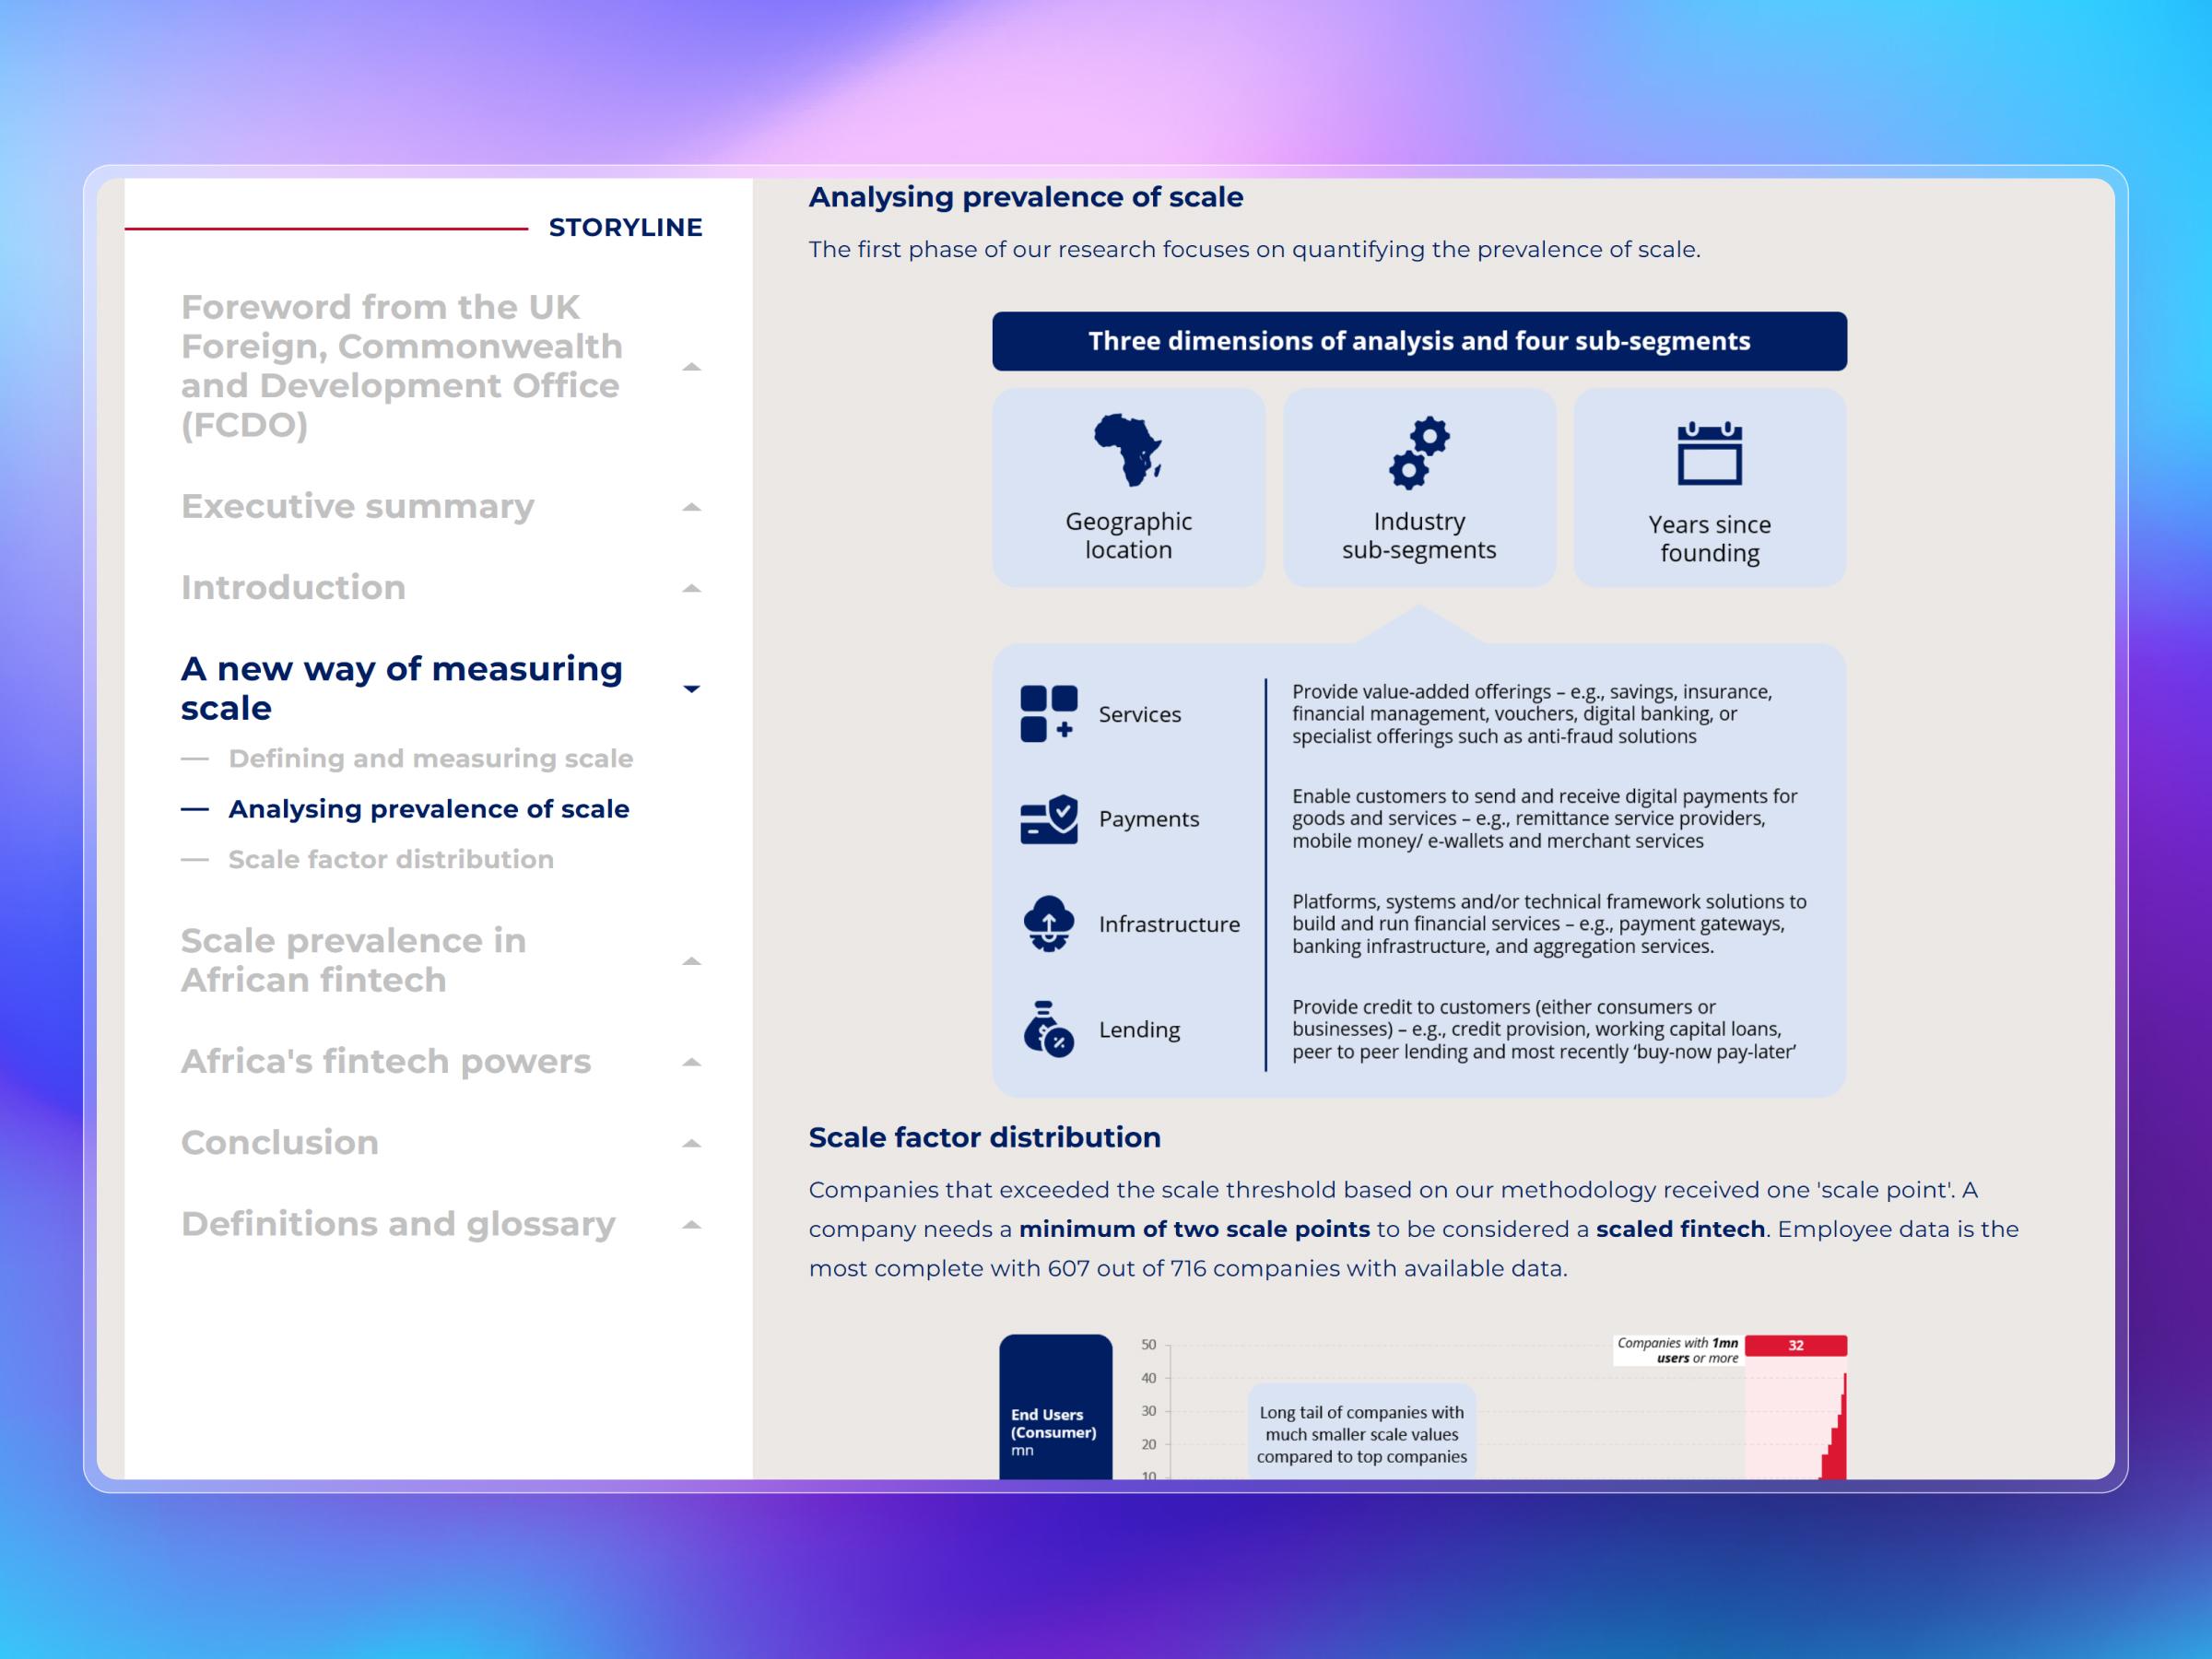
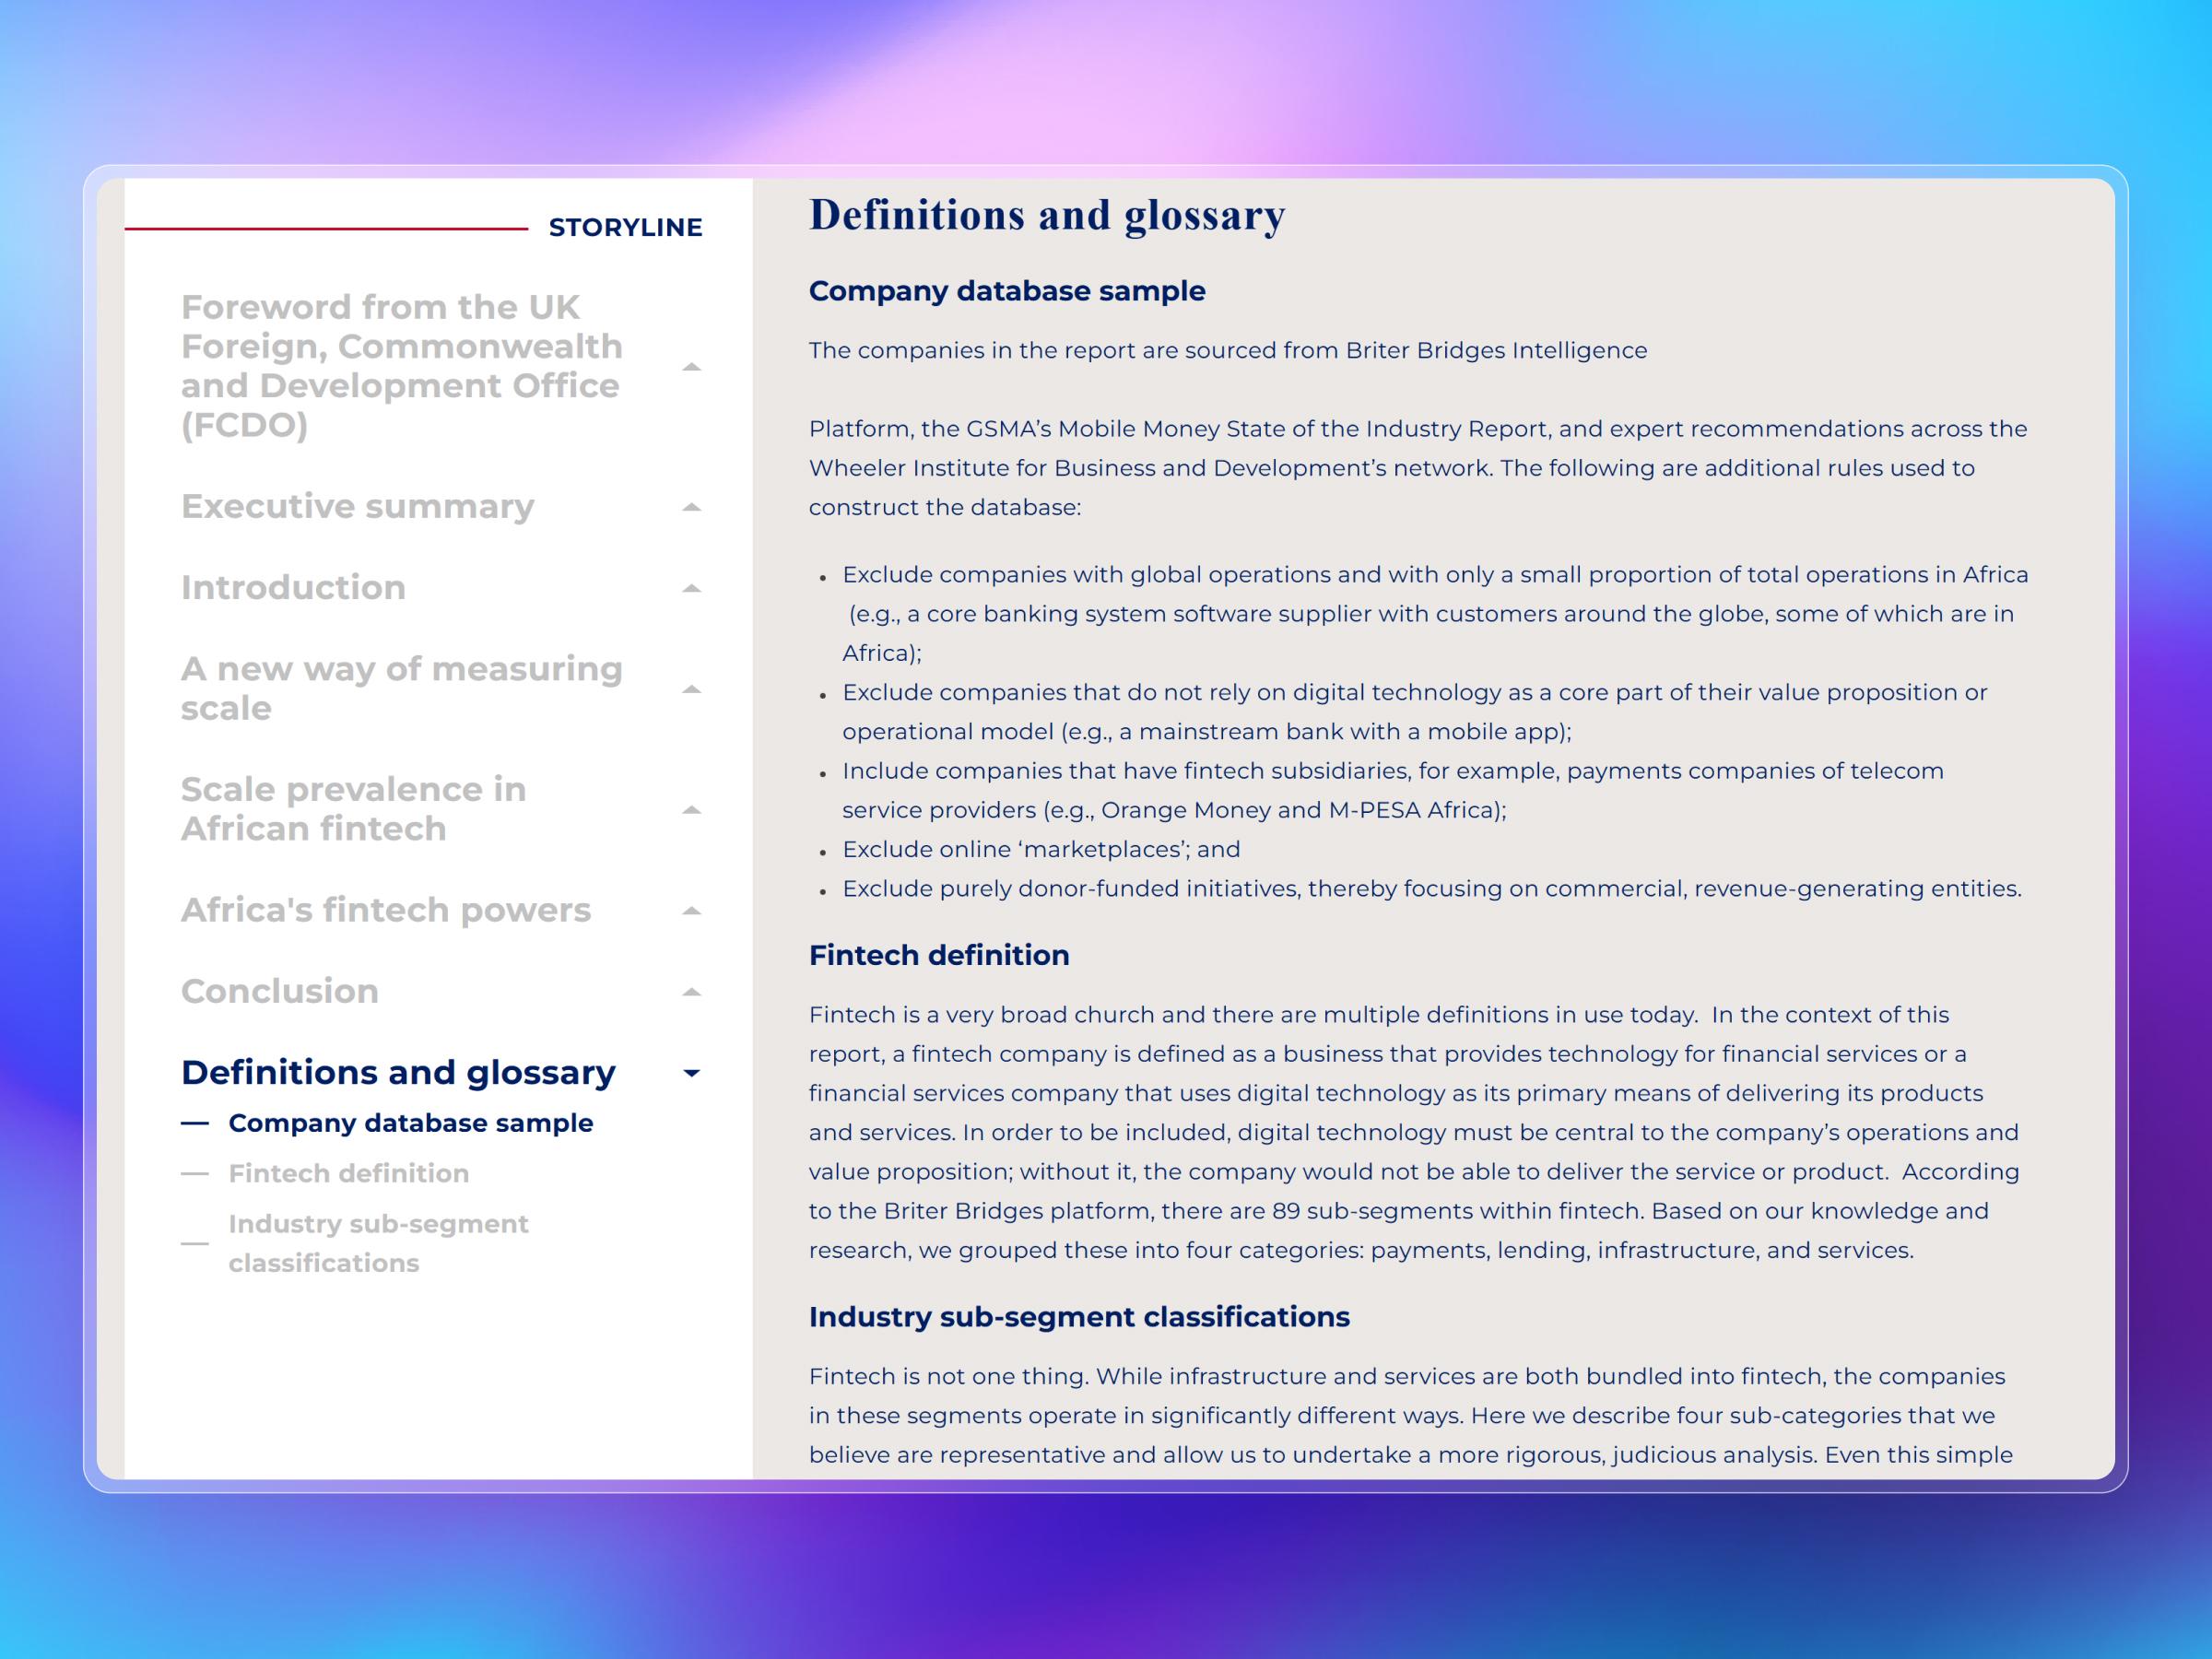
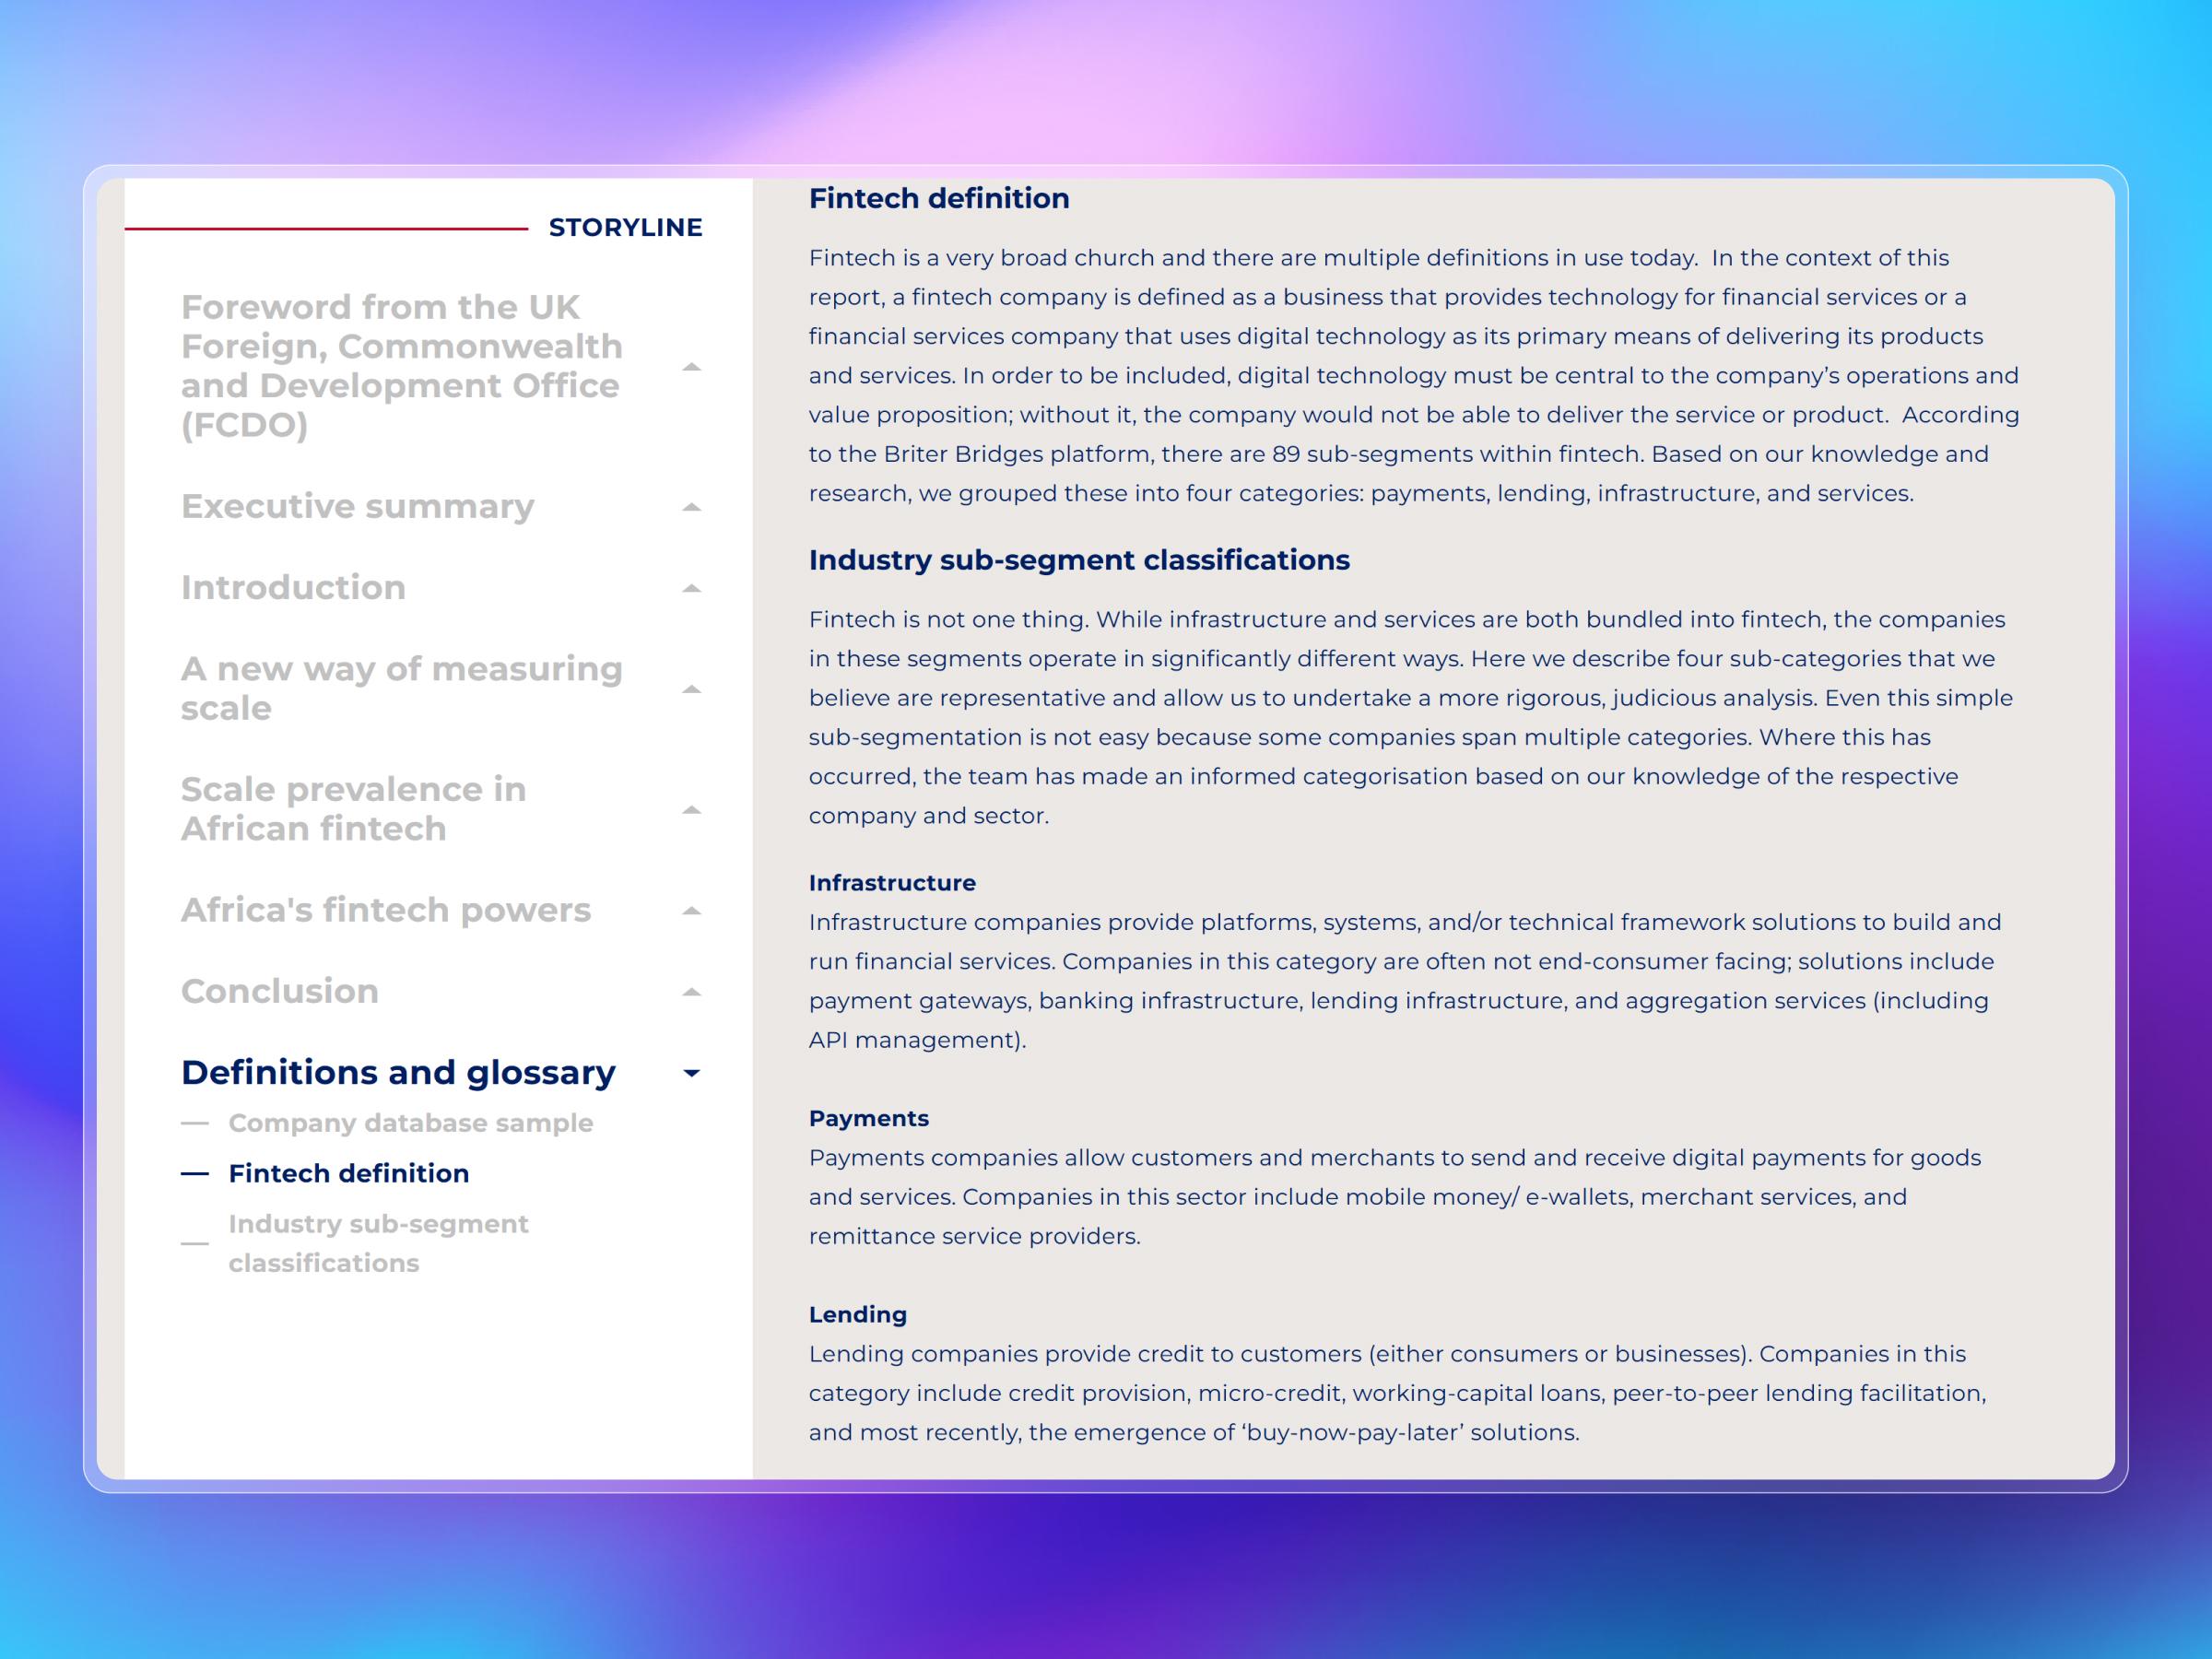
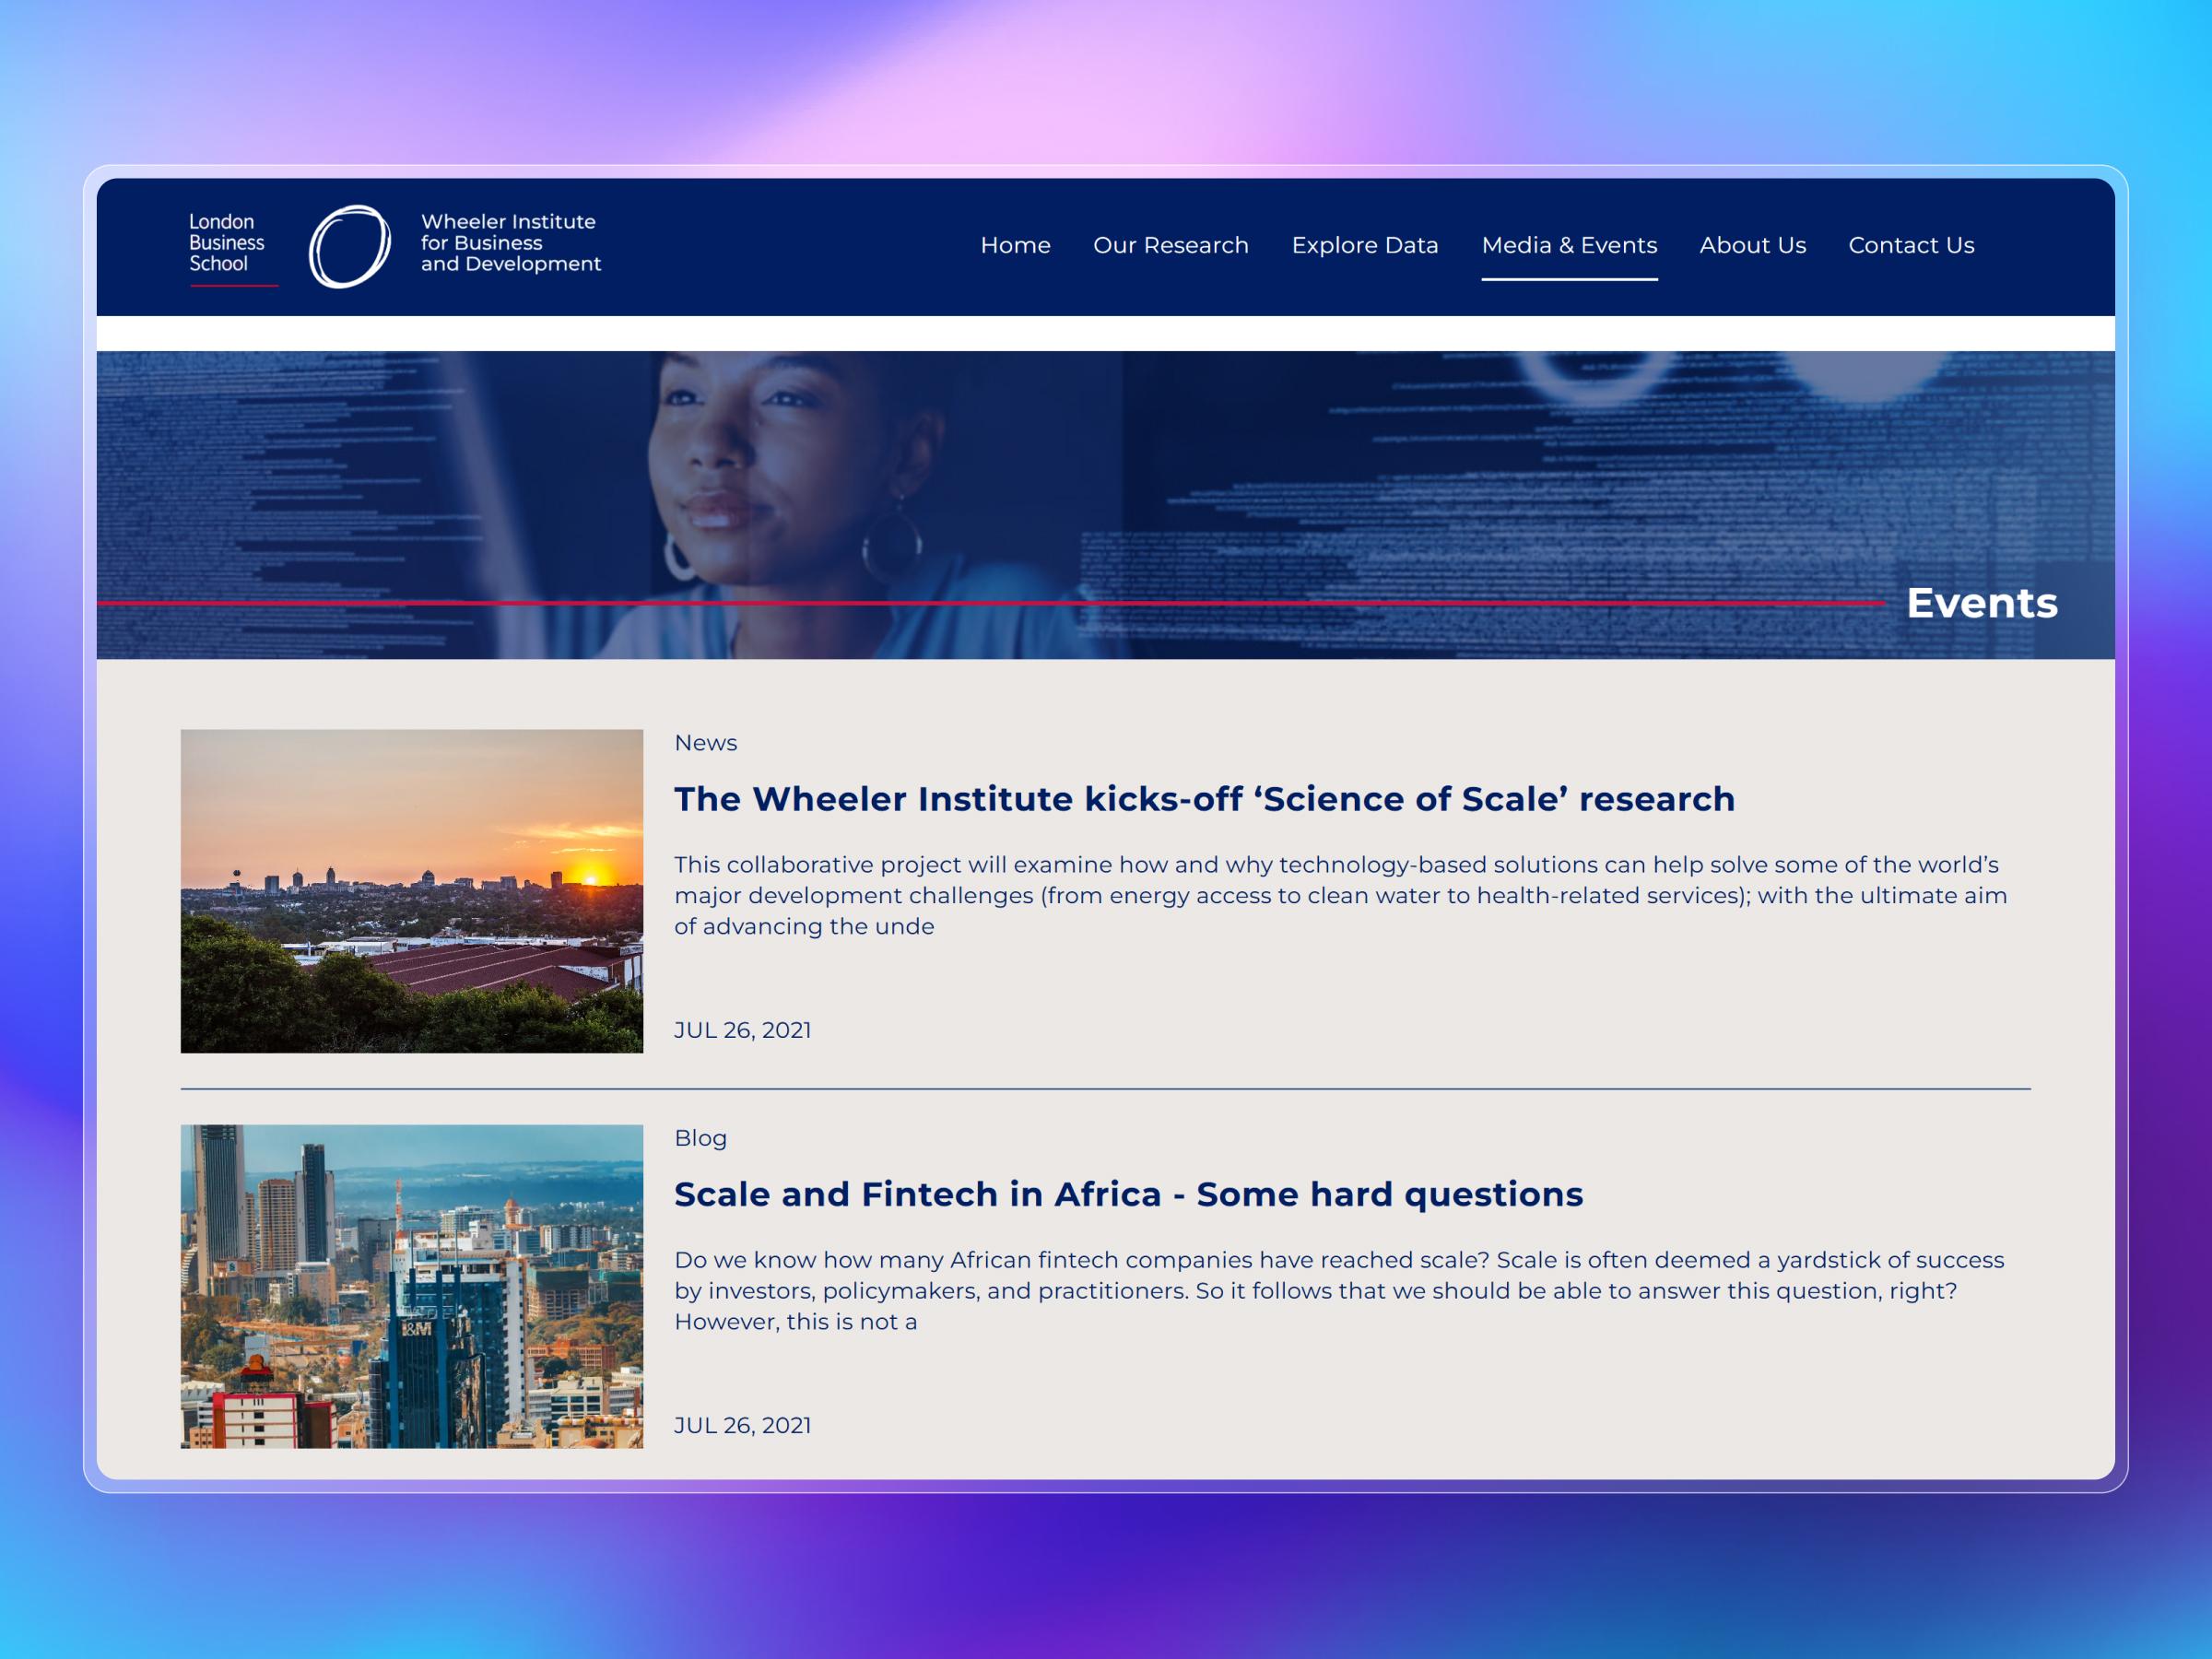
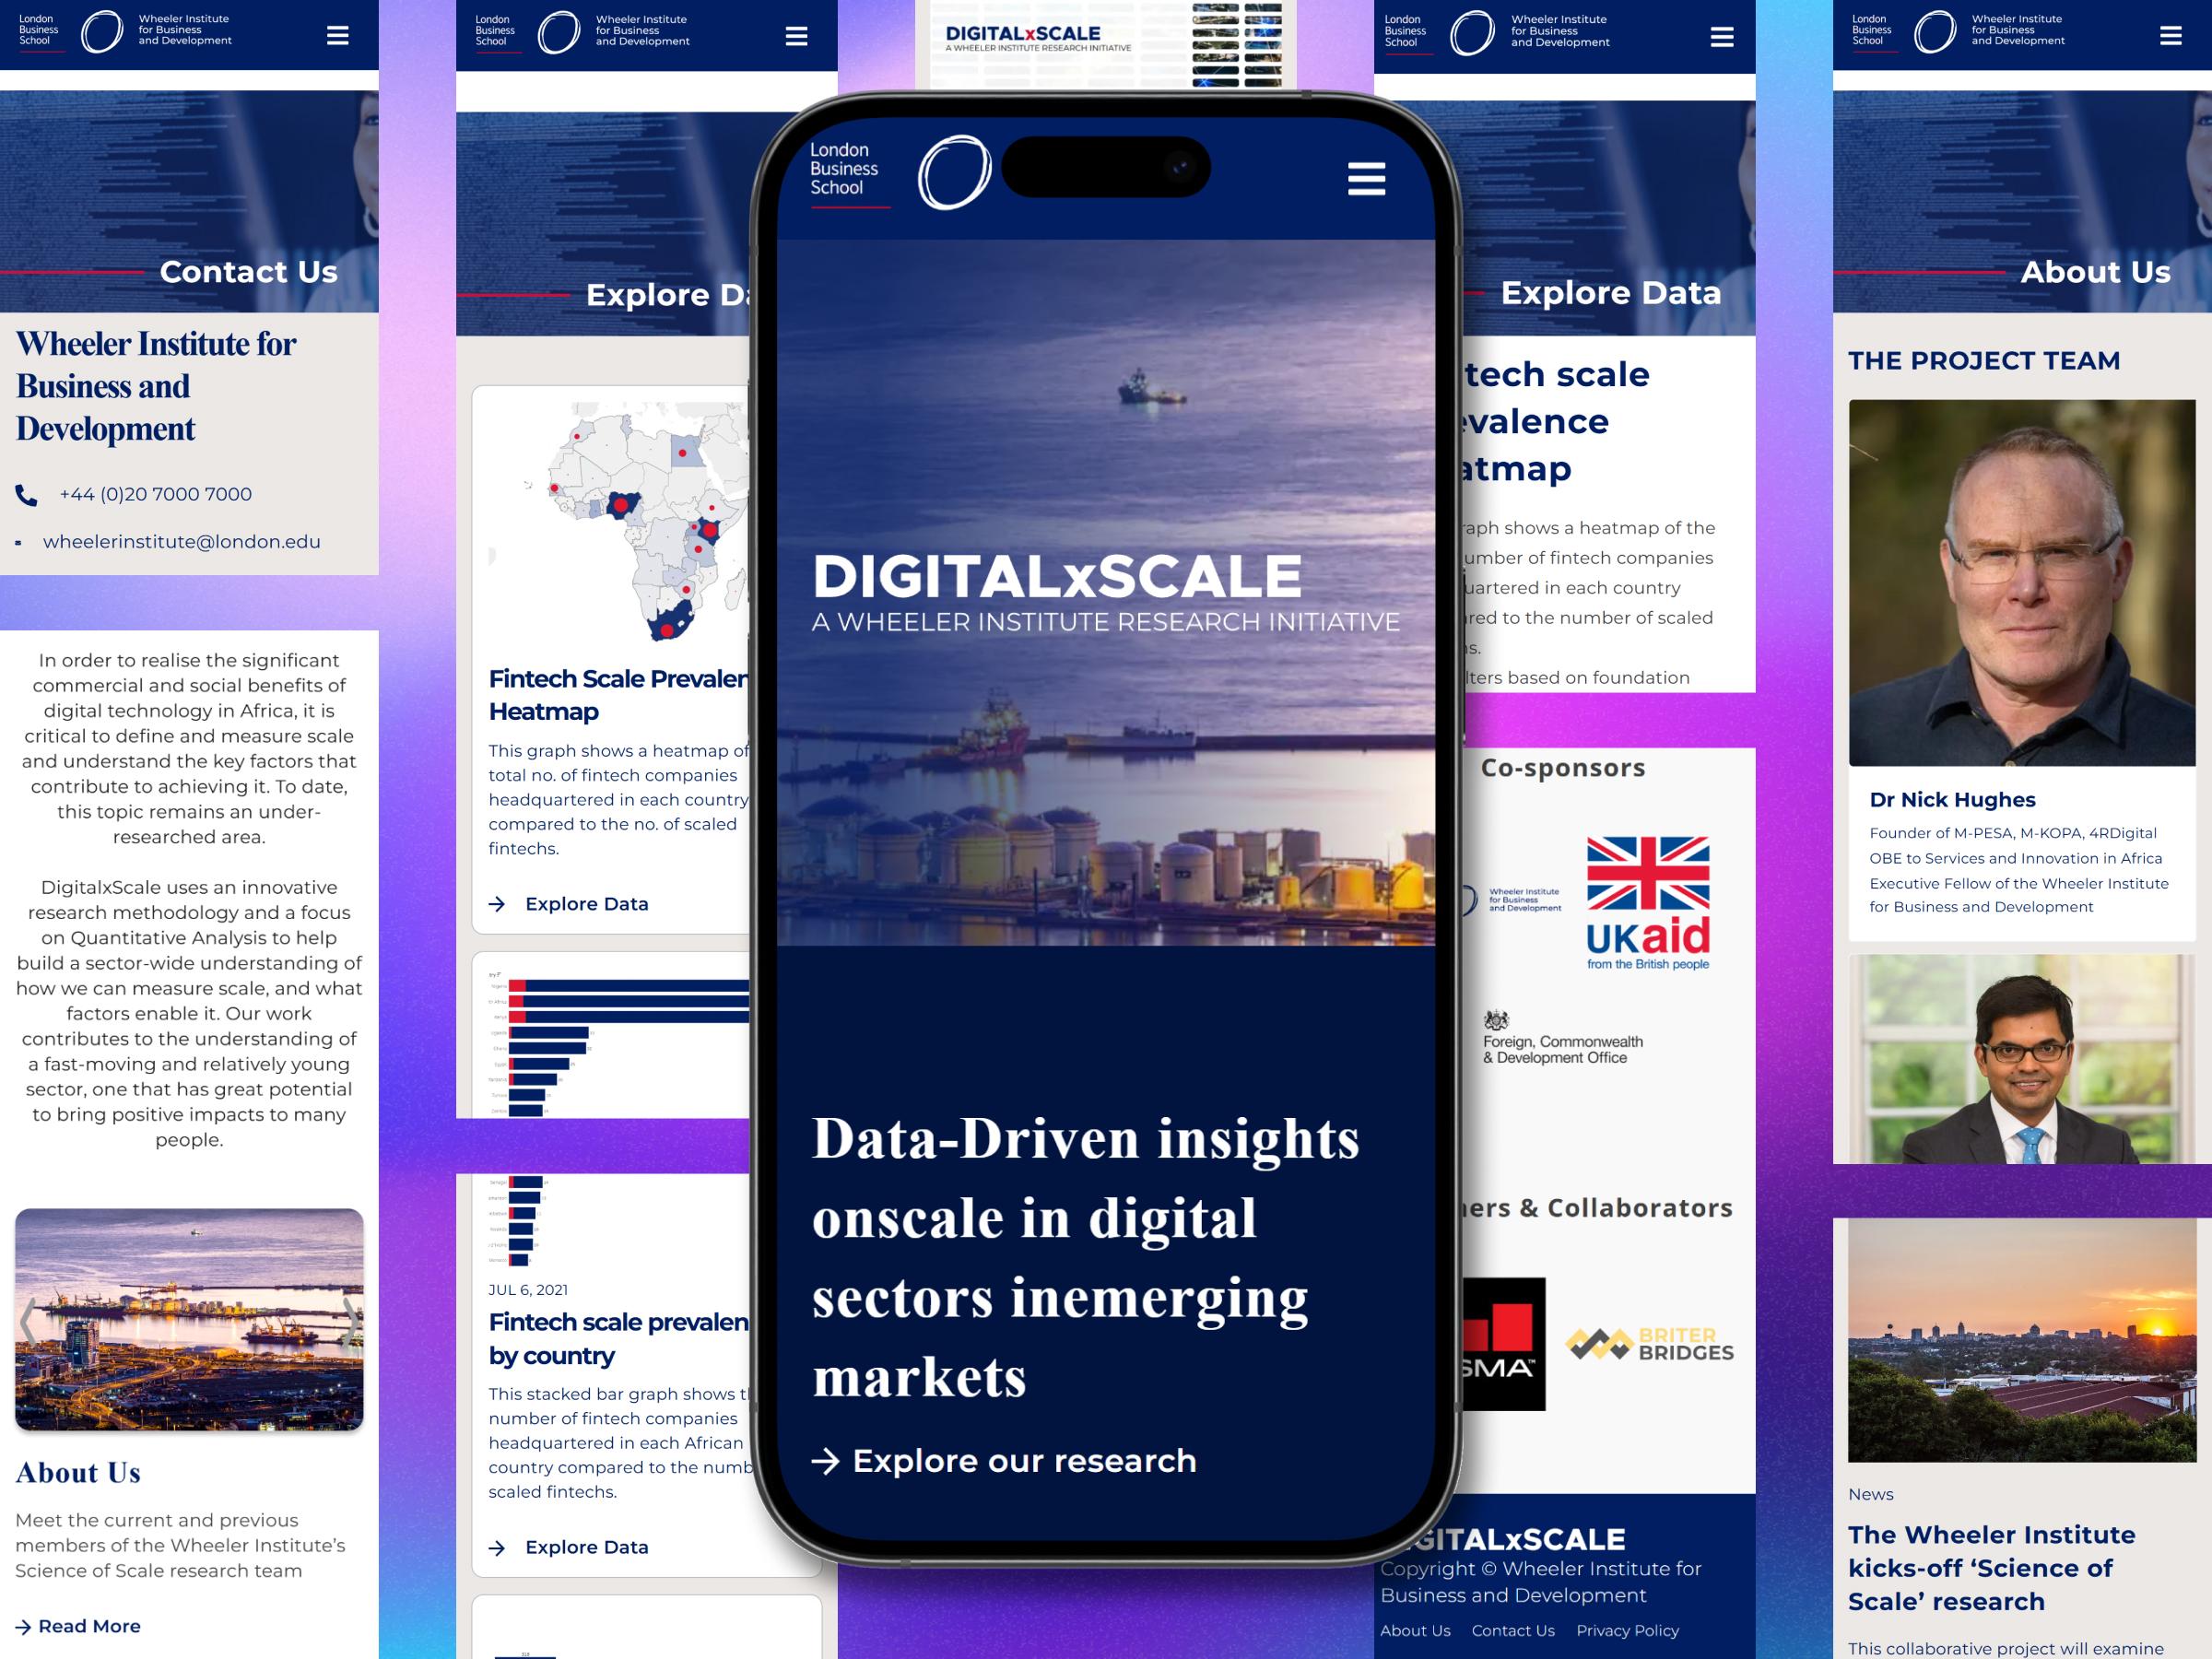
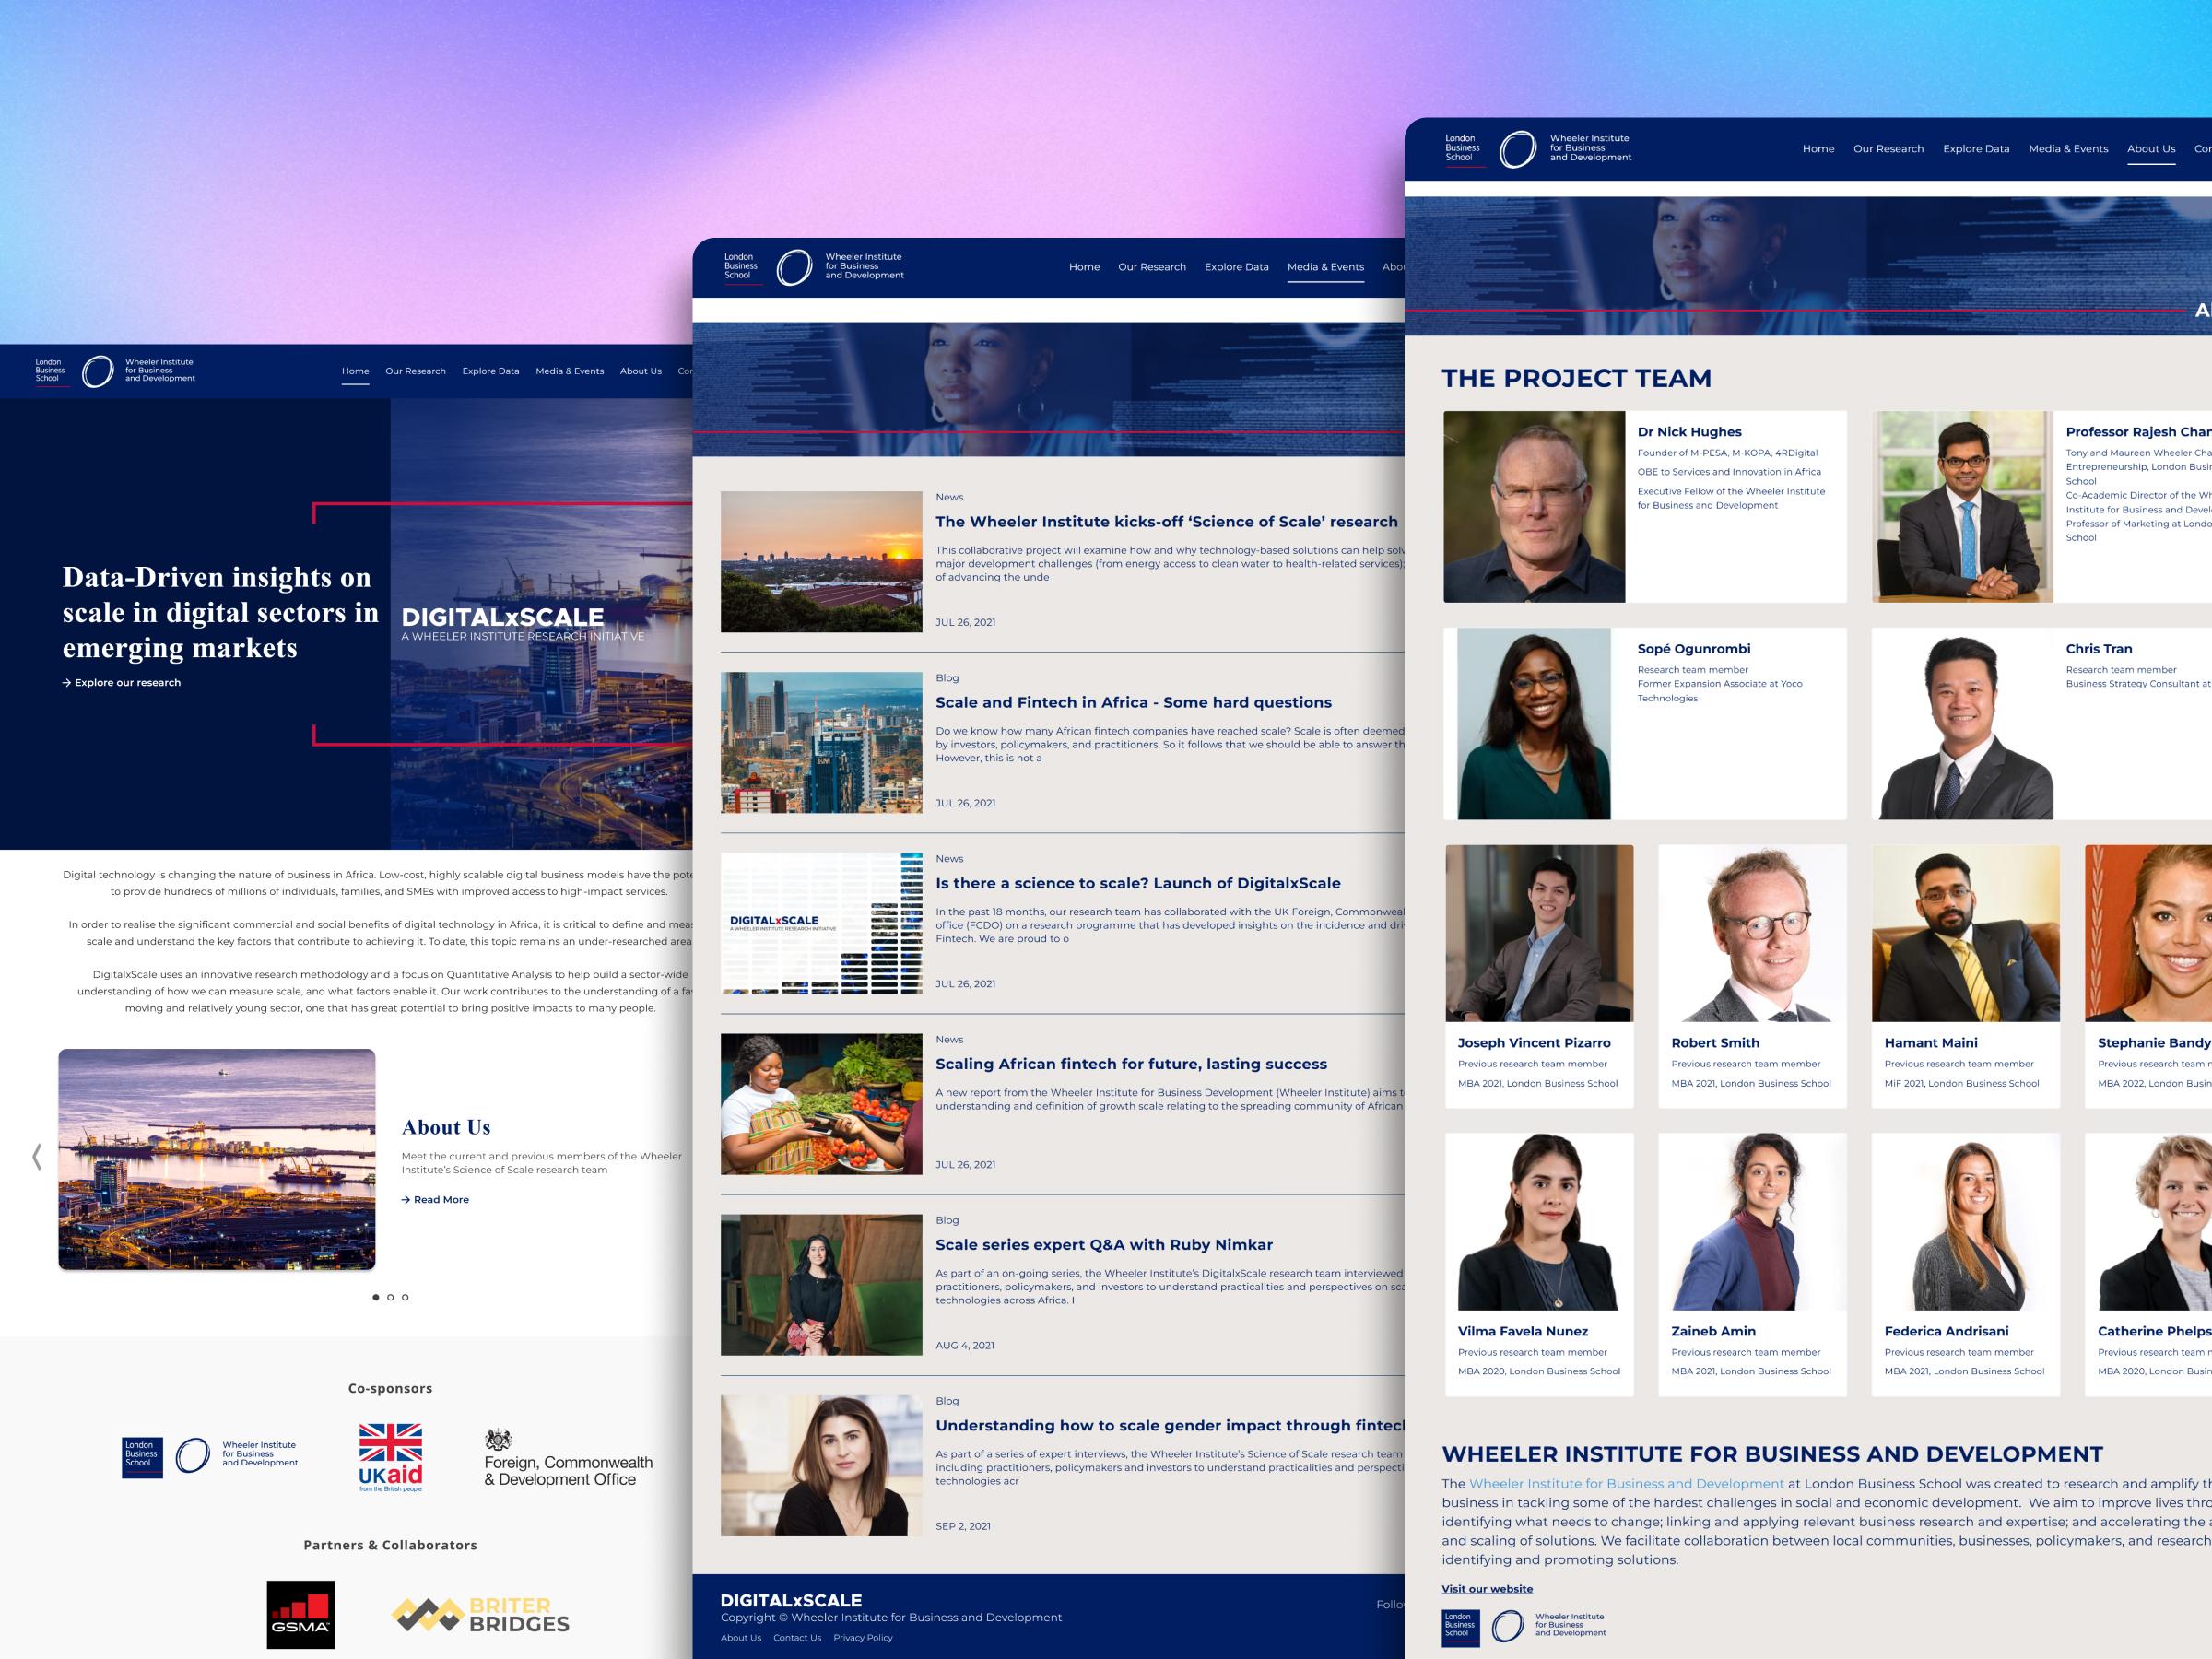
A research platform needs to do more than display papers — it needs to organise them in a way that researchers and policymakers can navigate efficiently. That means: a structured content repository with filtering by topic, geography, and publication type; a CMS the research team can operate without developer involvement; media management for videos and podcasts; and — if the research is data-heavy — tools to present that data visually. For DigitalXScale, the Wheeler Institute also needed the ability to generate infographics directly from their Excel data without design or development resources.

Why build a custom CMS instead of using WordPress for a university research website?

WordPress is a general-purpose CMS designed primarily for blogs and marketing sites. Academic research has a different content model — papers have authors, institutions, topics, geographies, publication types, and datasets attached to them. Forcing that into WordPress means fighting the system constantly. A custom CMS built on Node.js and PostgreSQL lets you model the content exactly as the institution's research is structured. The Wheeler Institute's team can manage their platform with a system built for how academic research actually works, not adapted from a blogging tool.

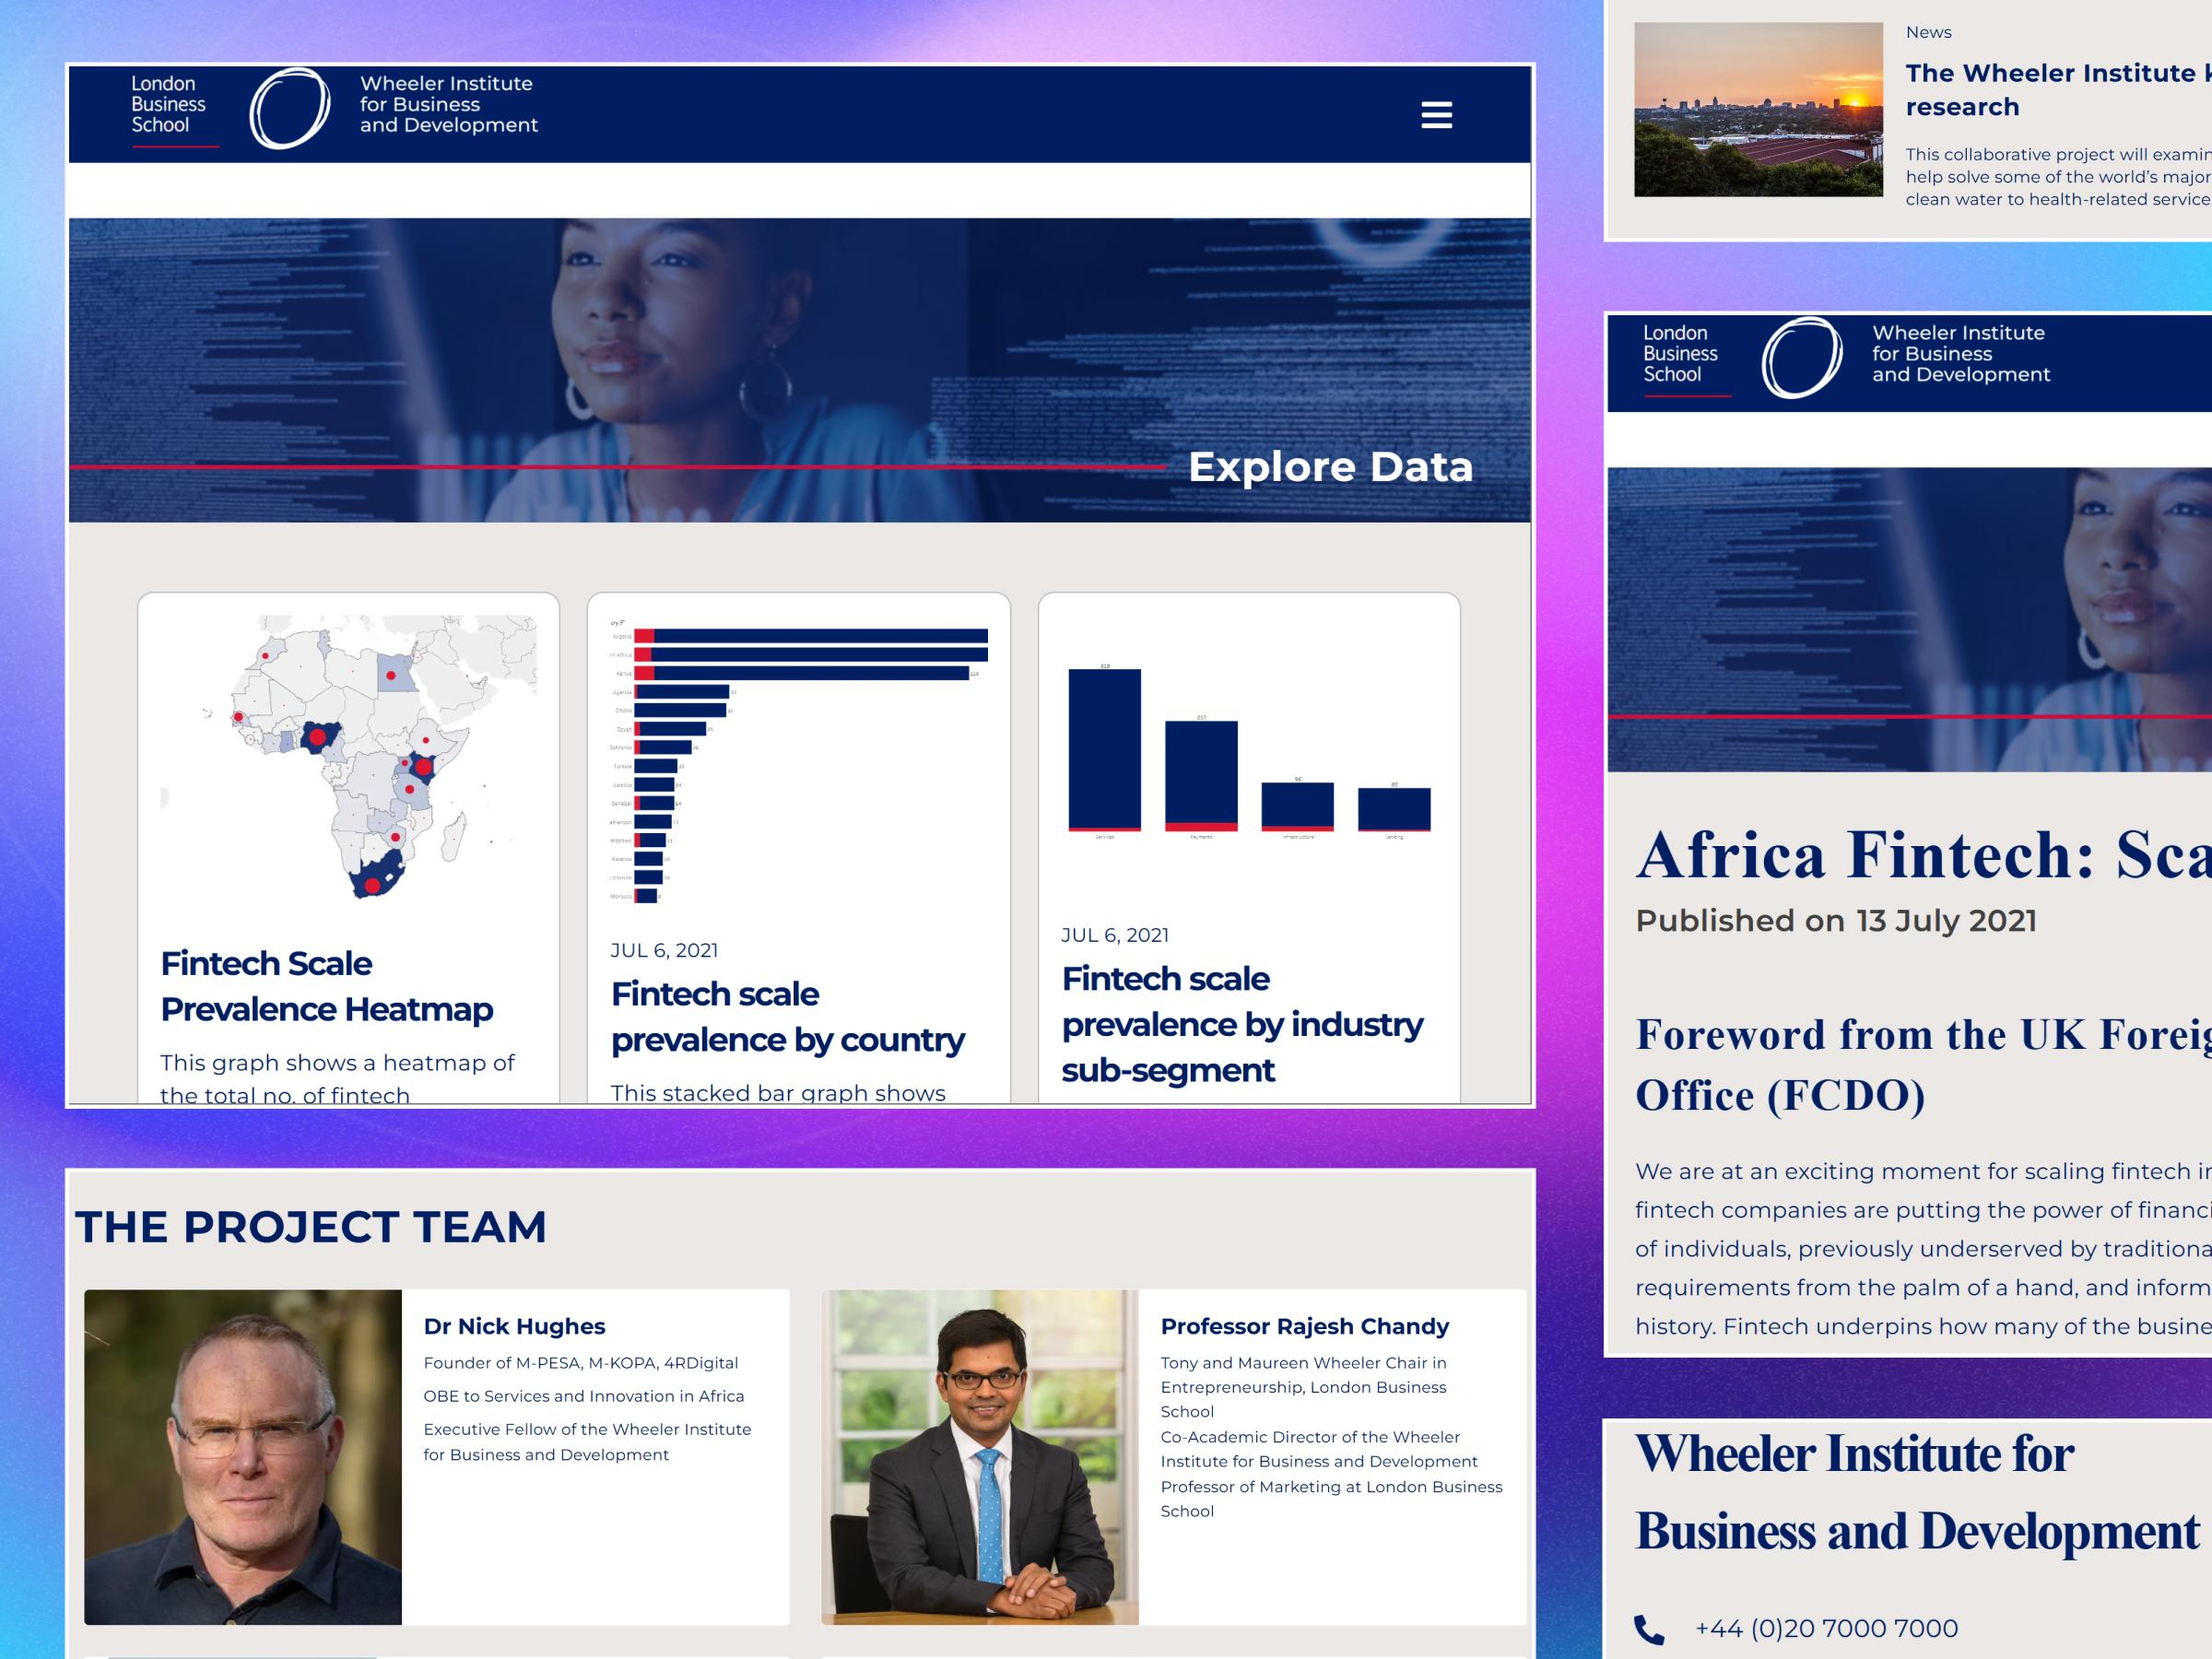
How do you turn Excel data into infographics on a website?

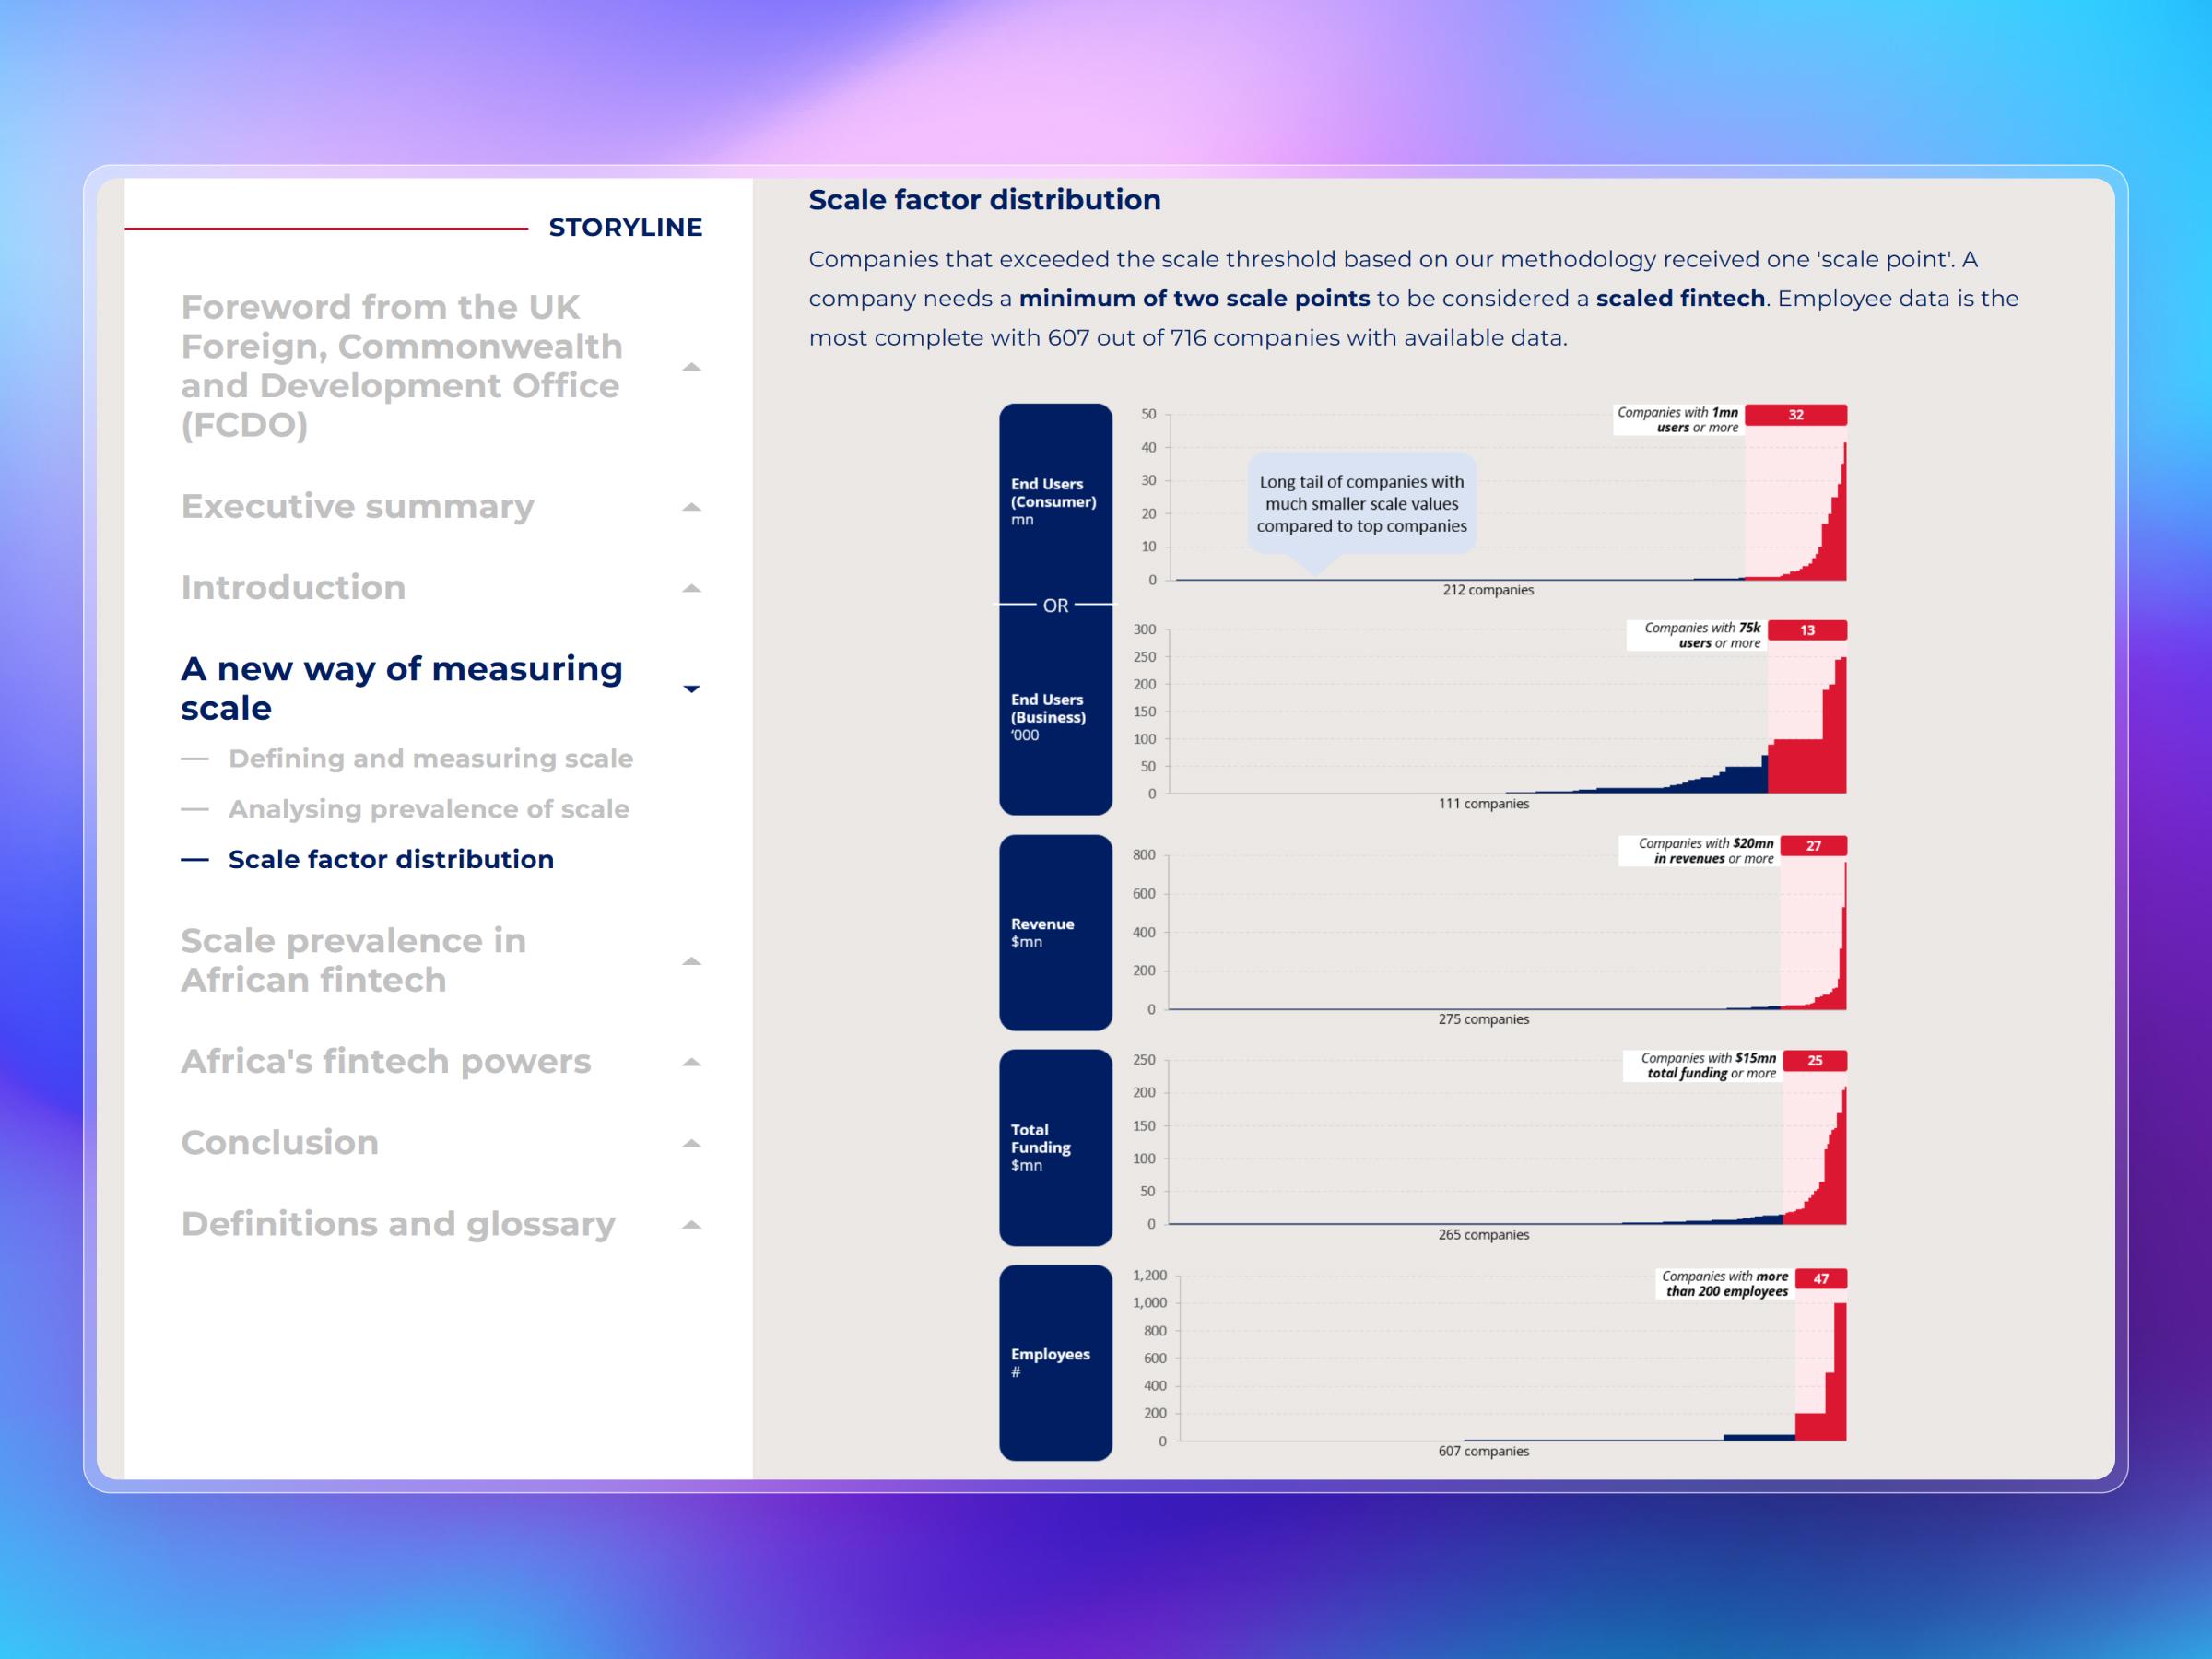
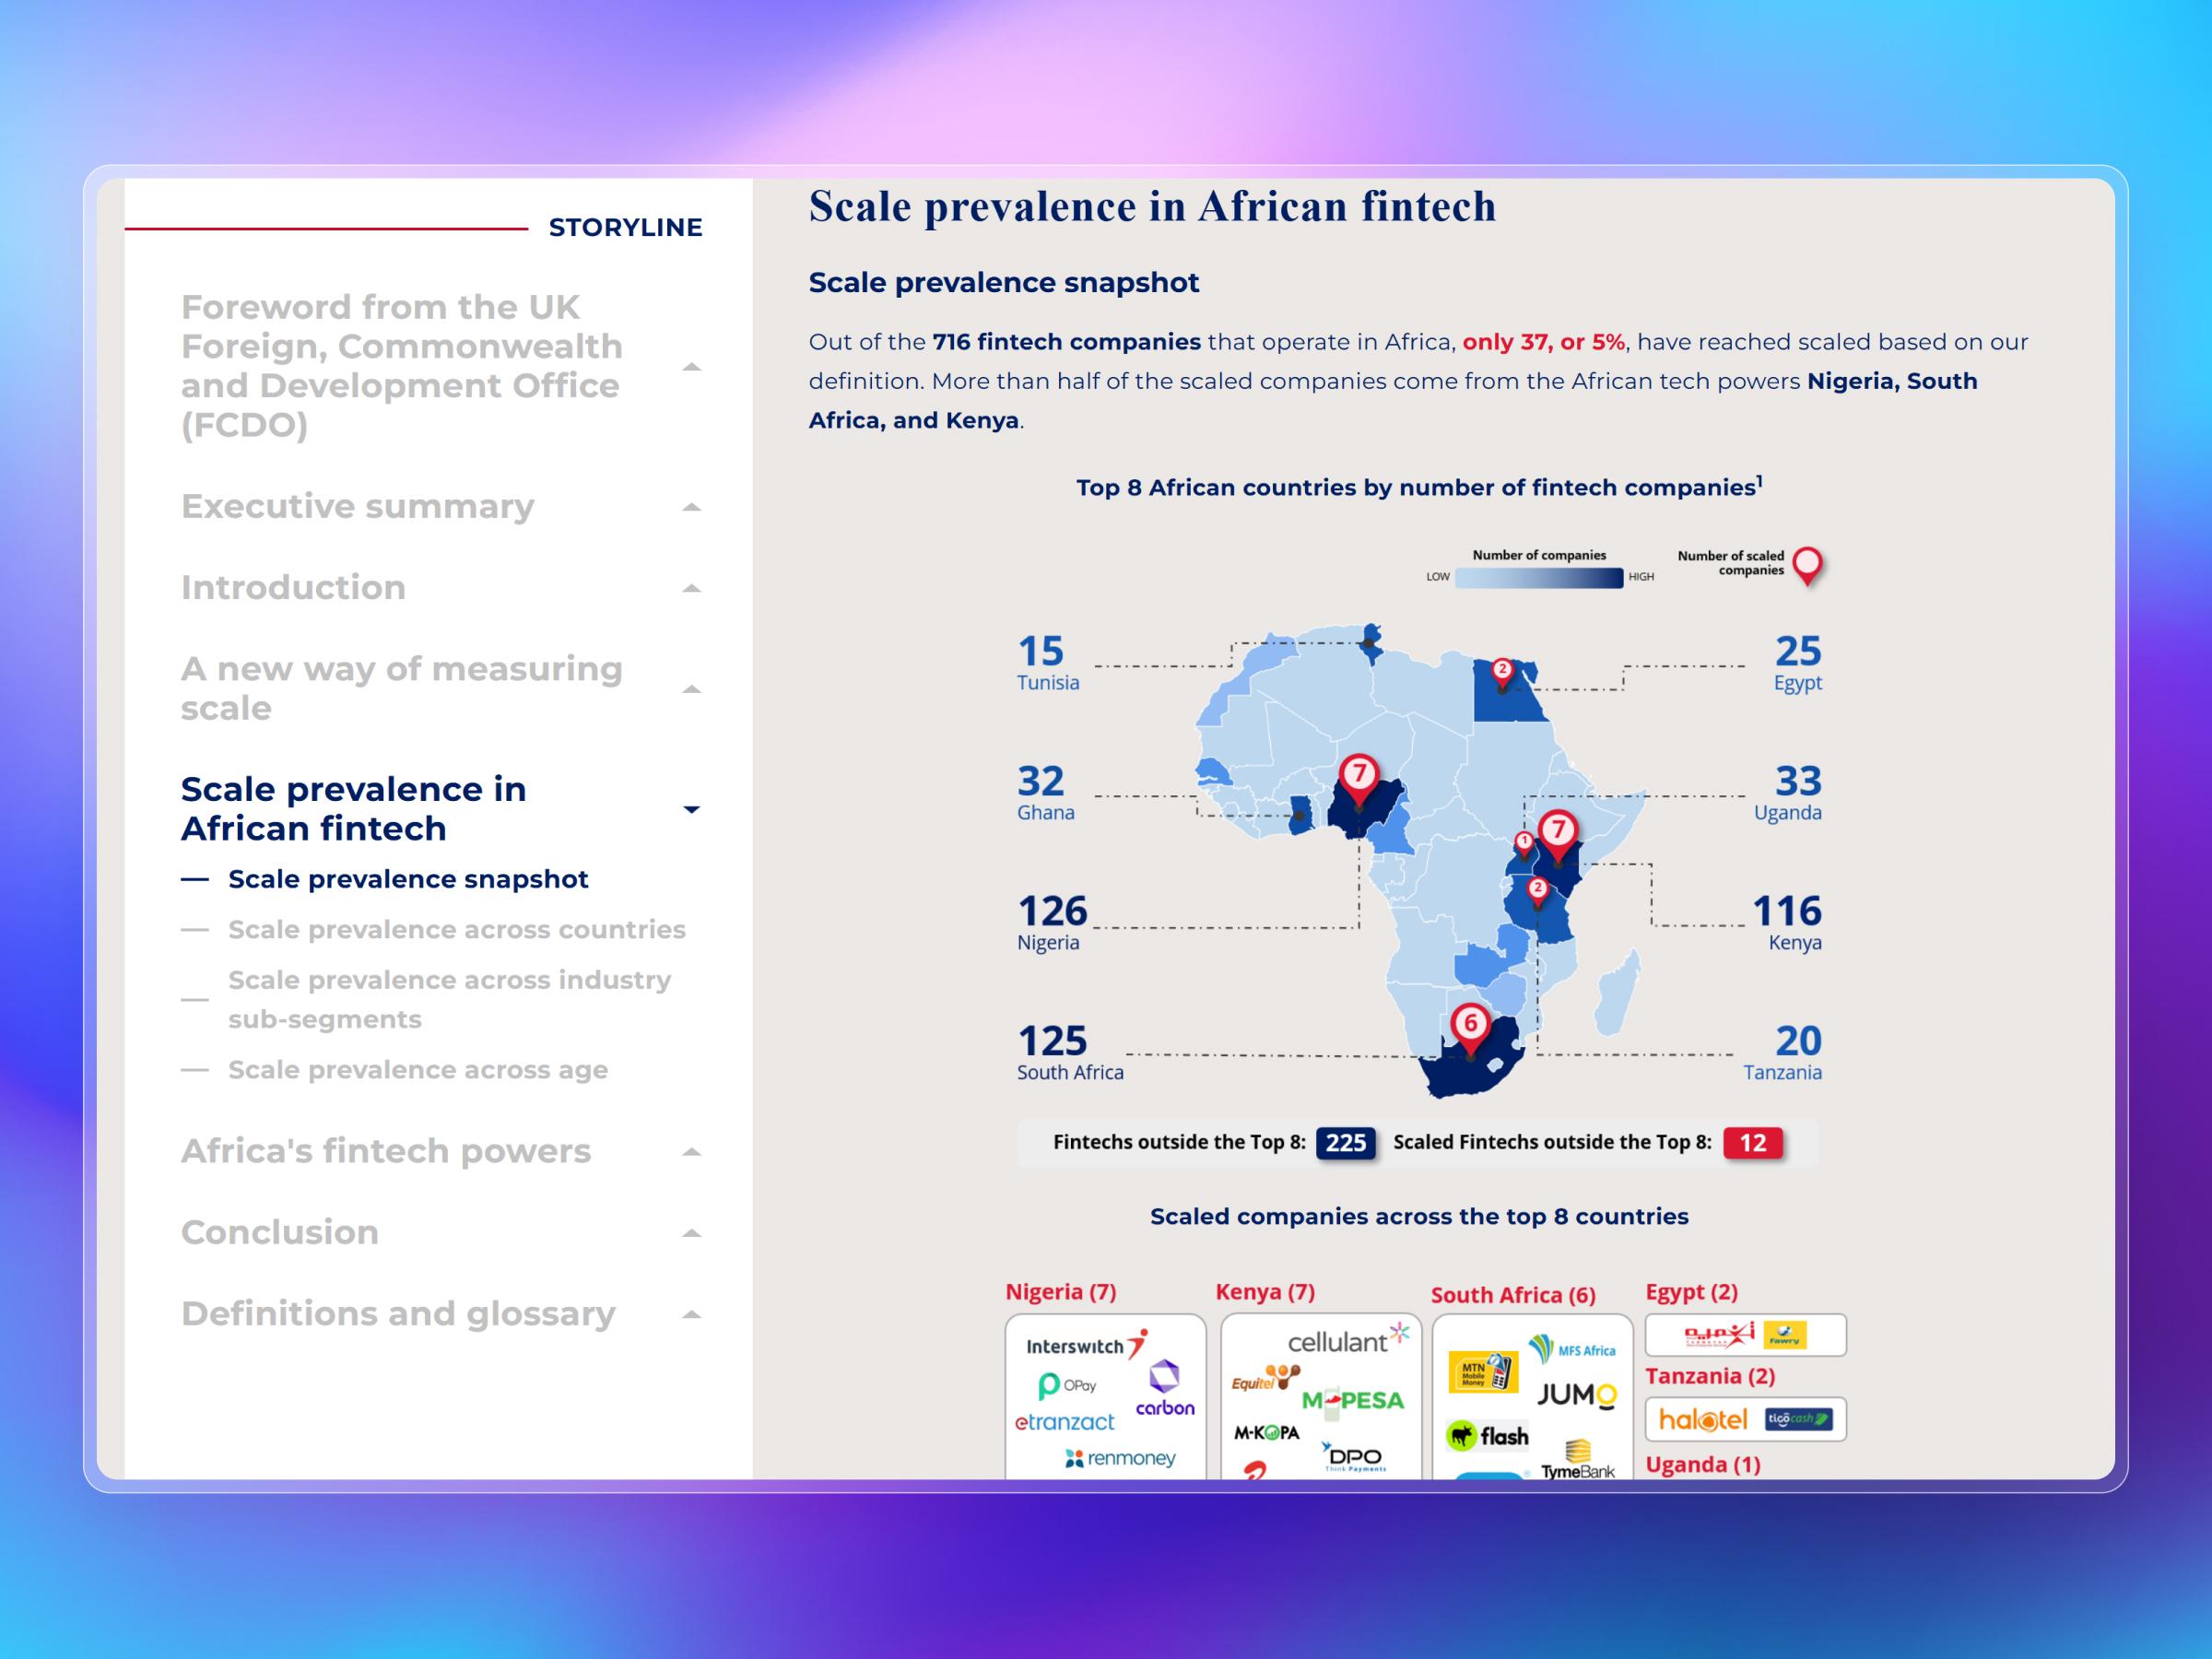
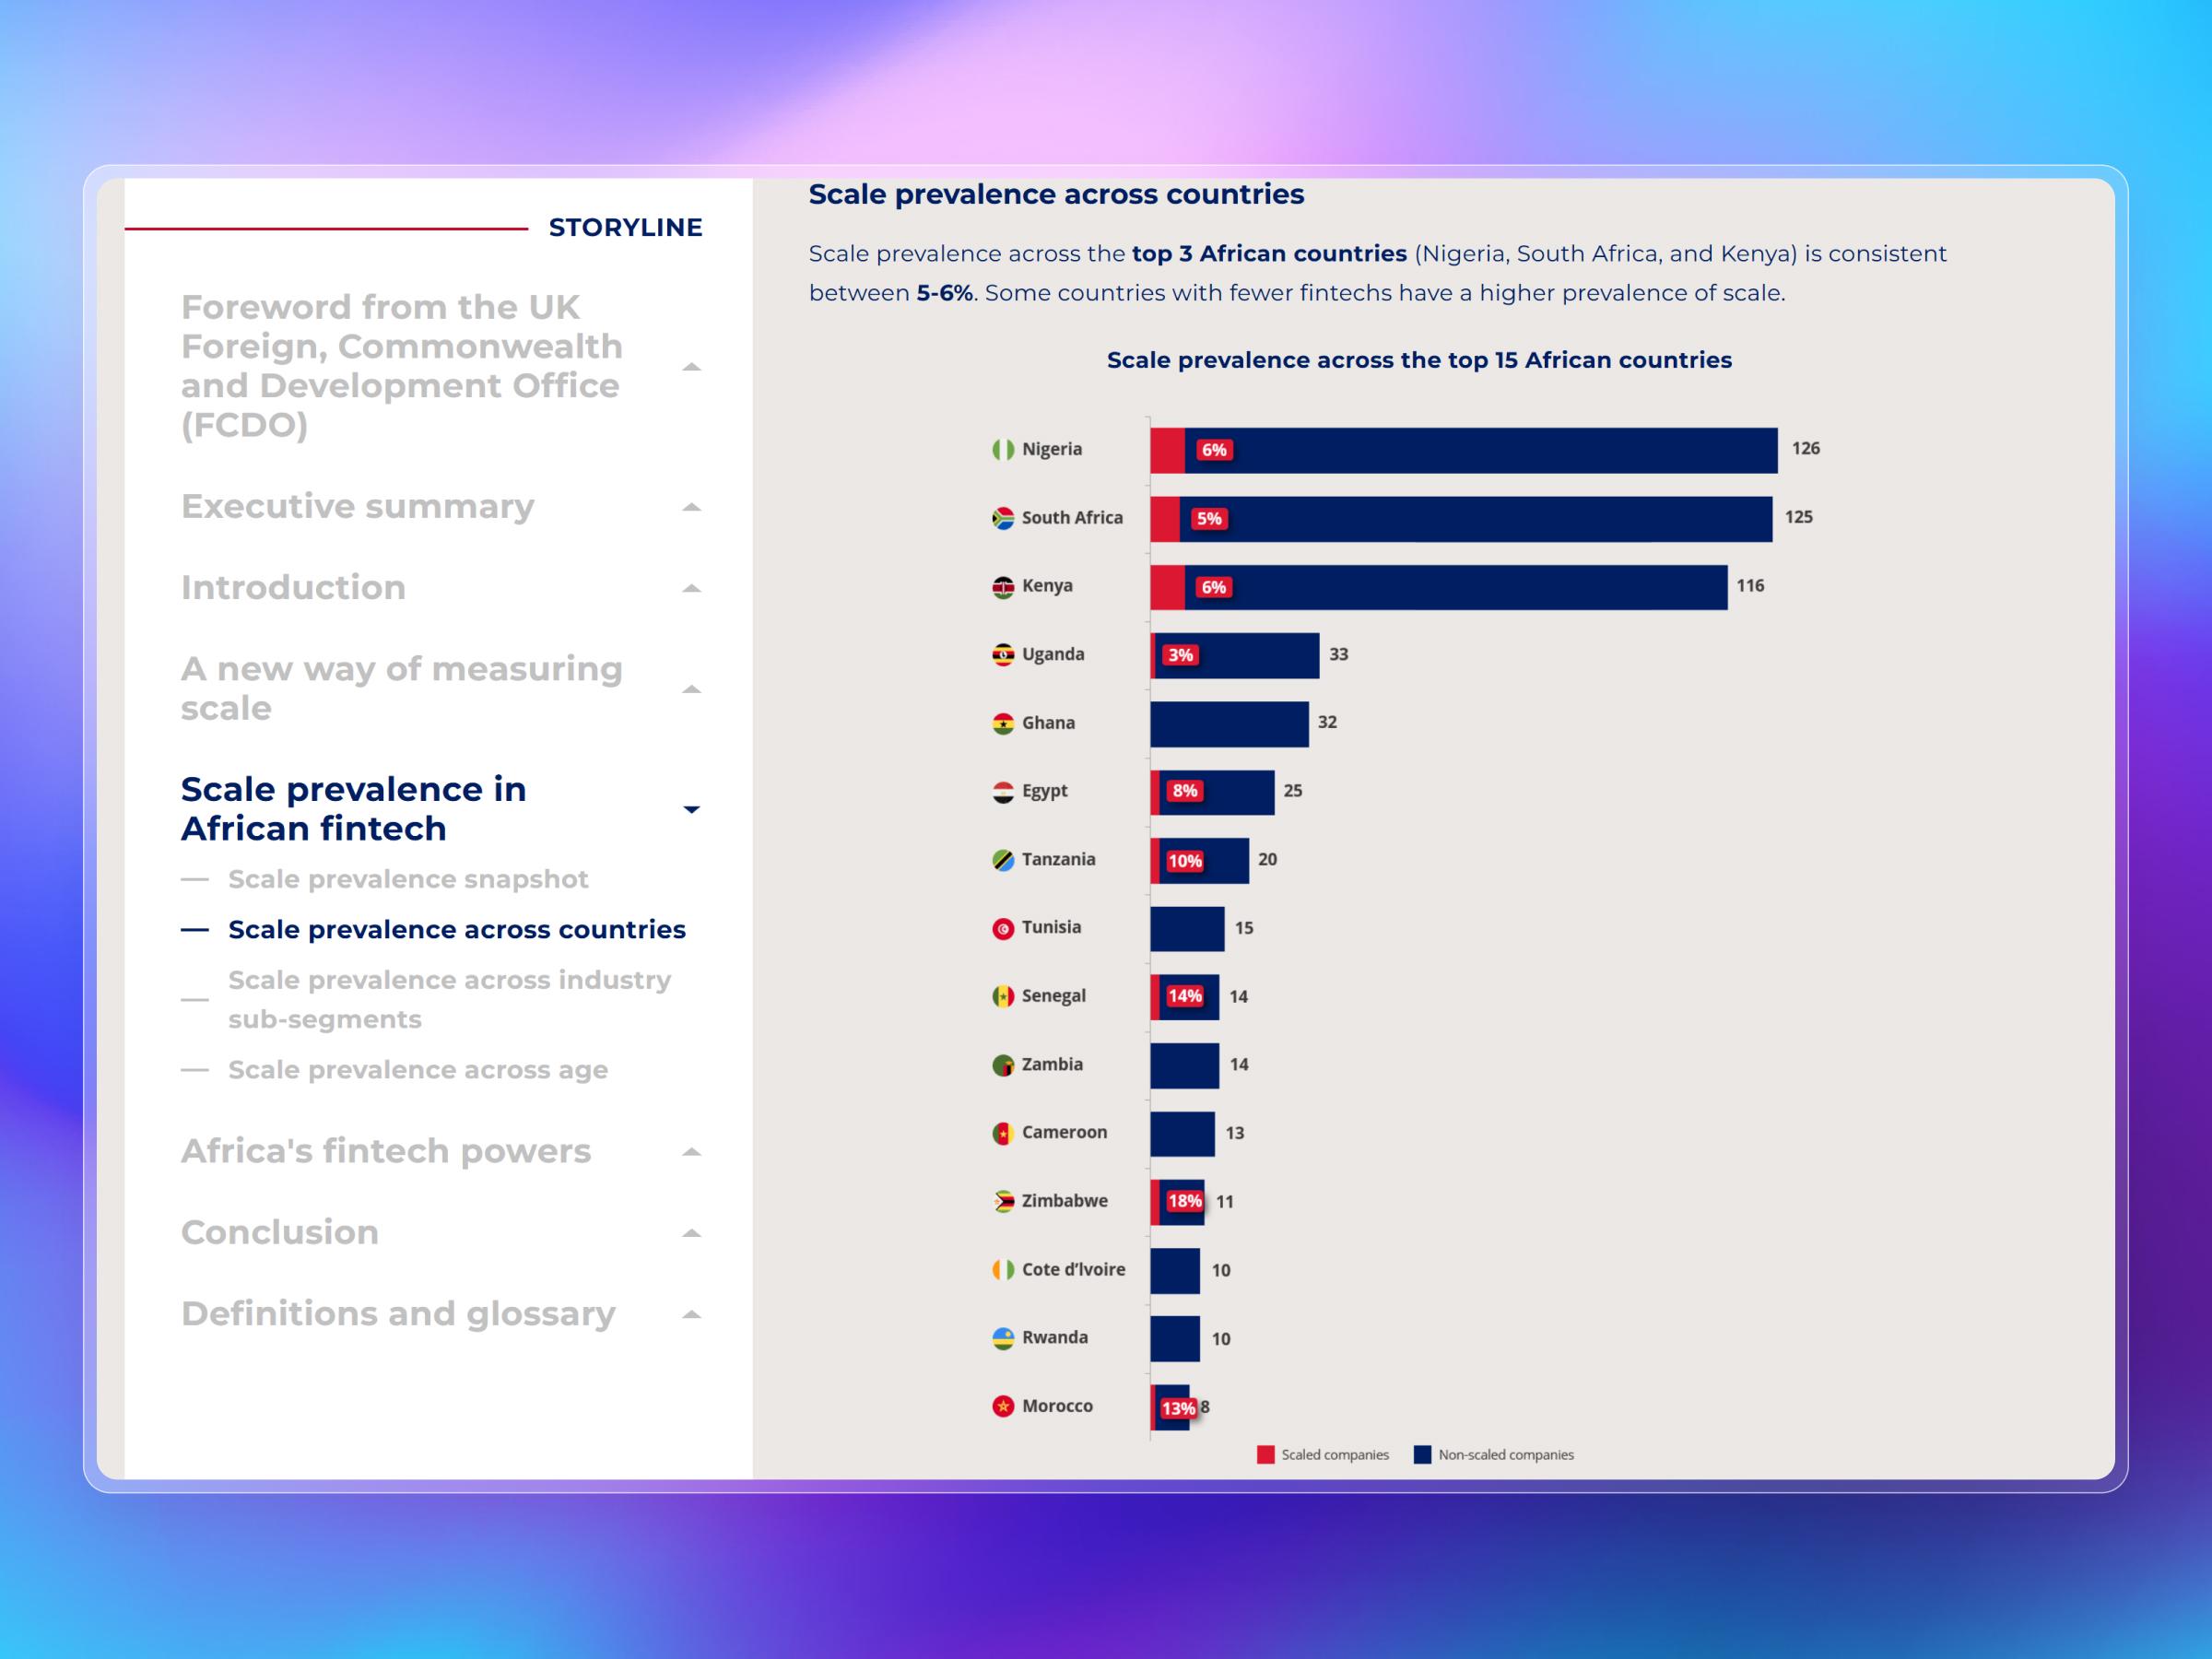
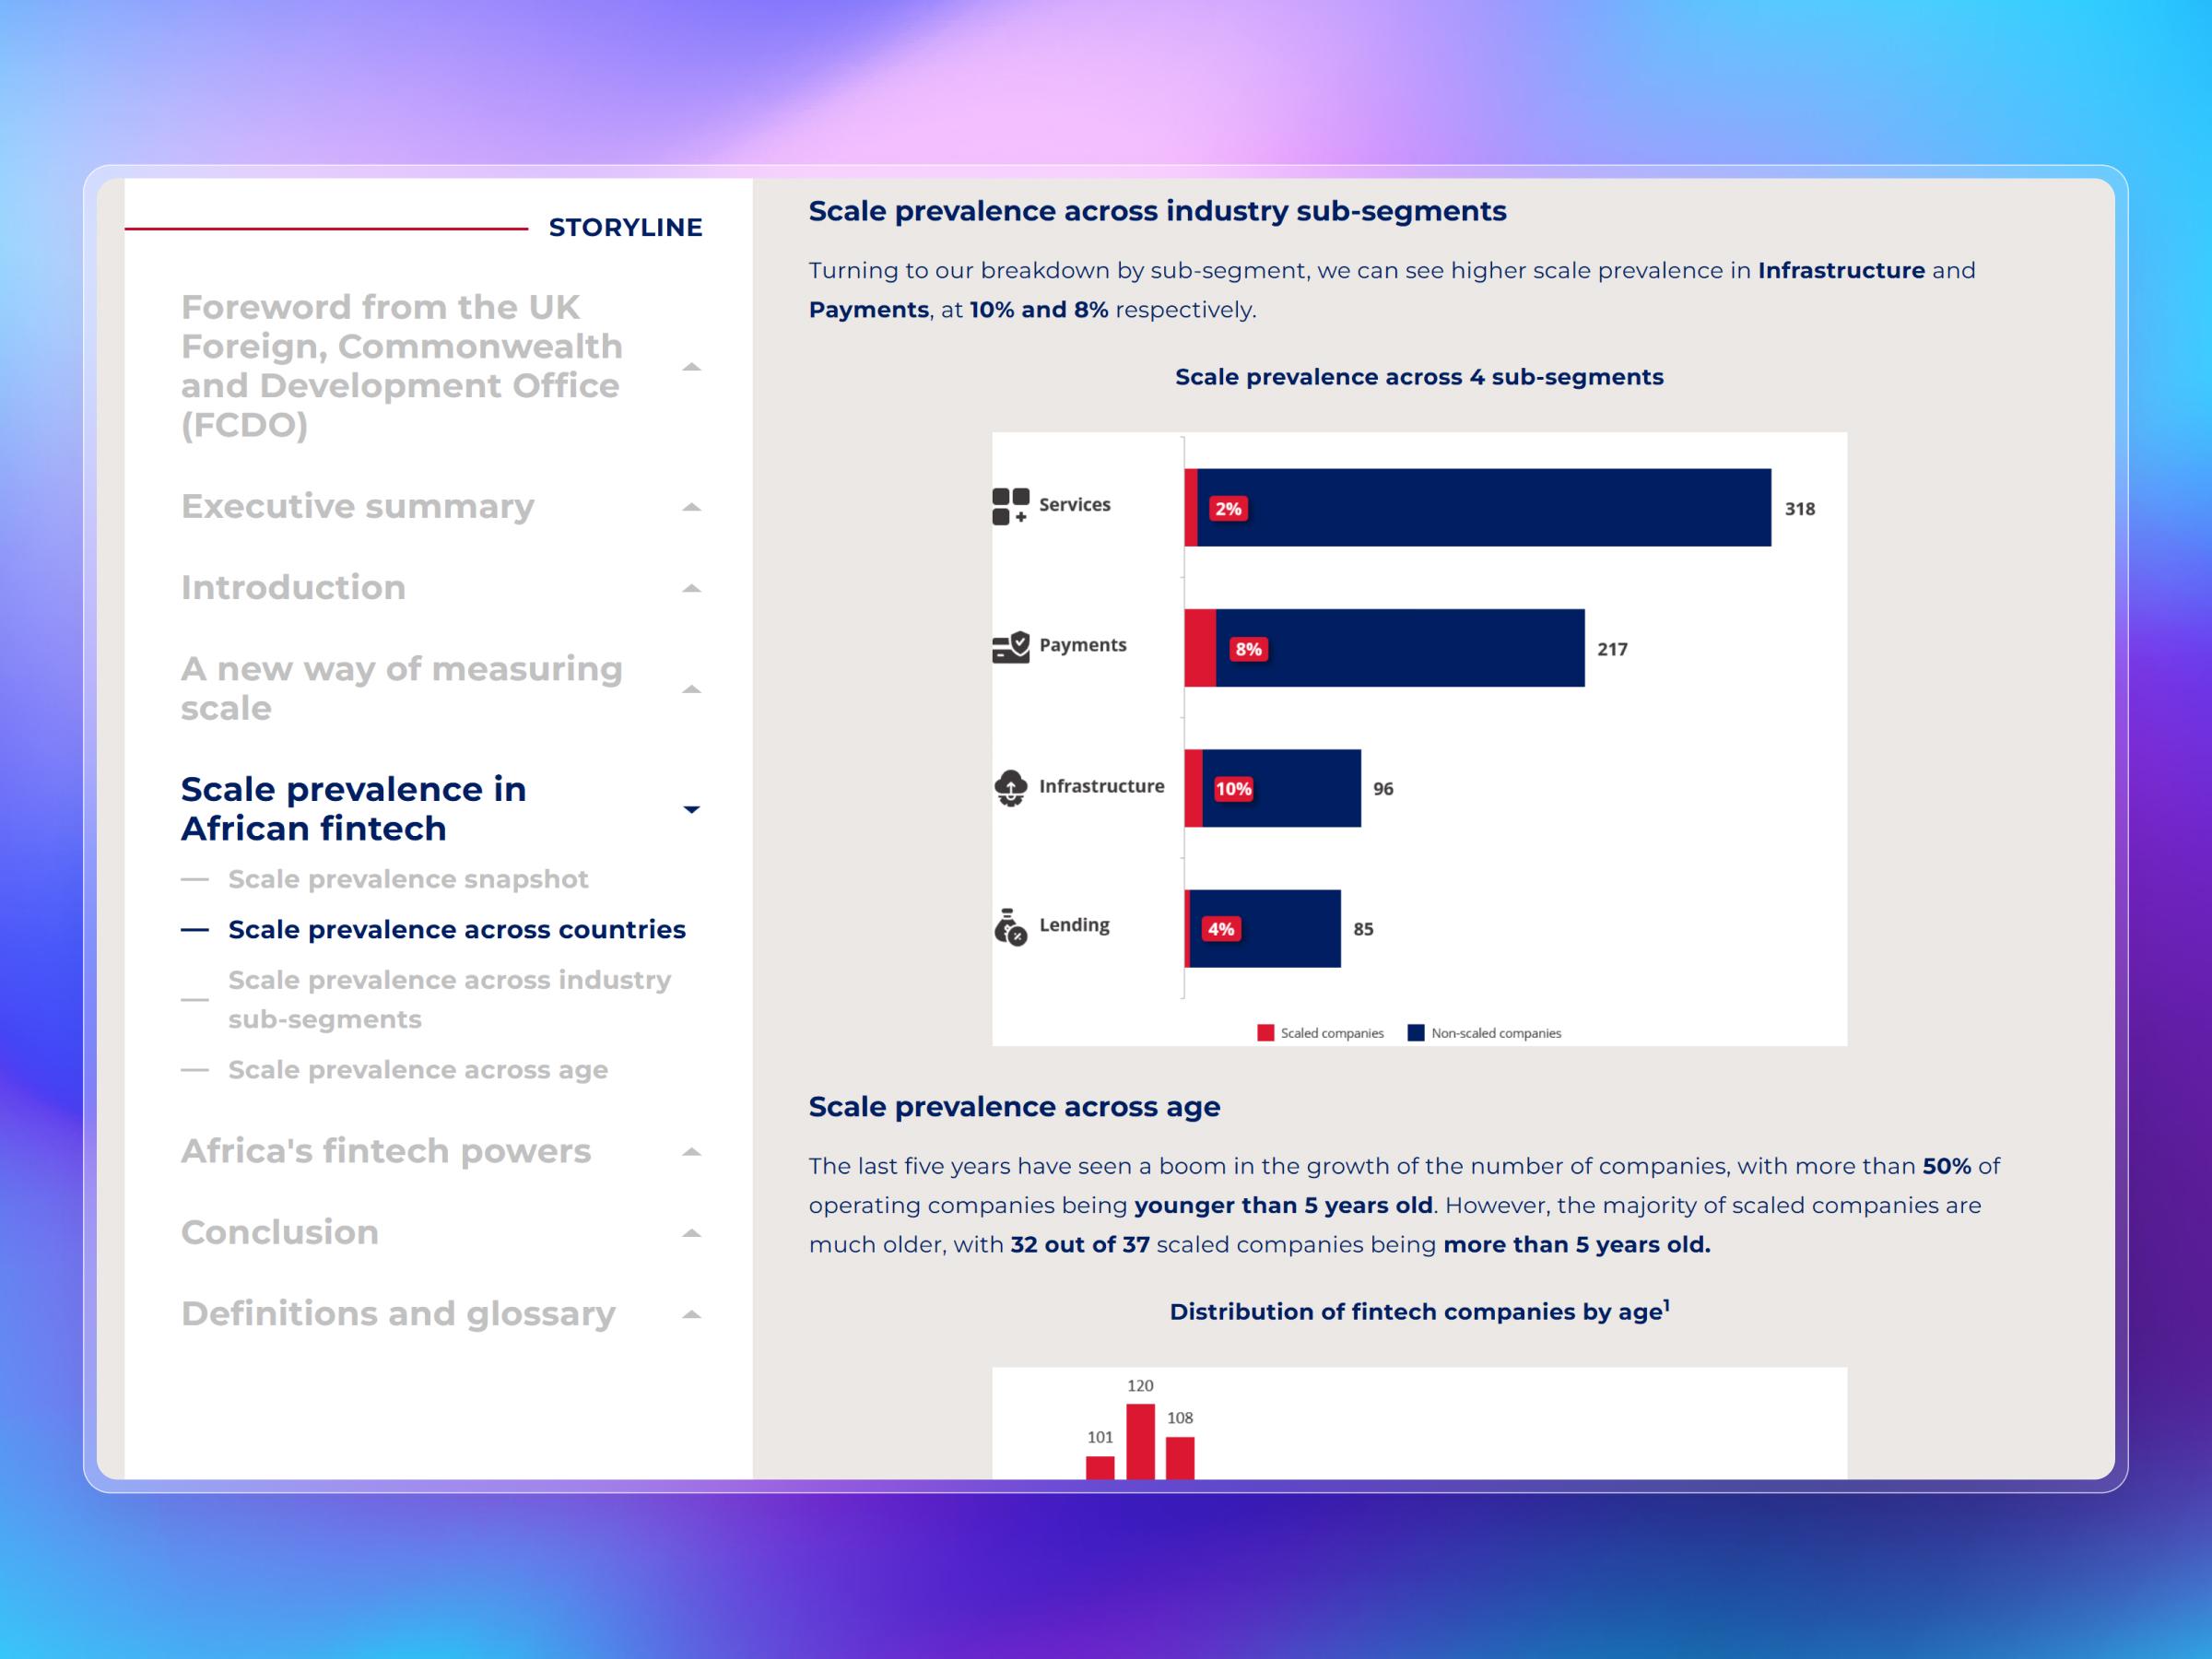
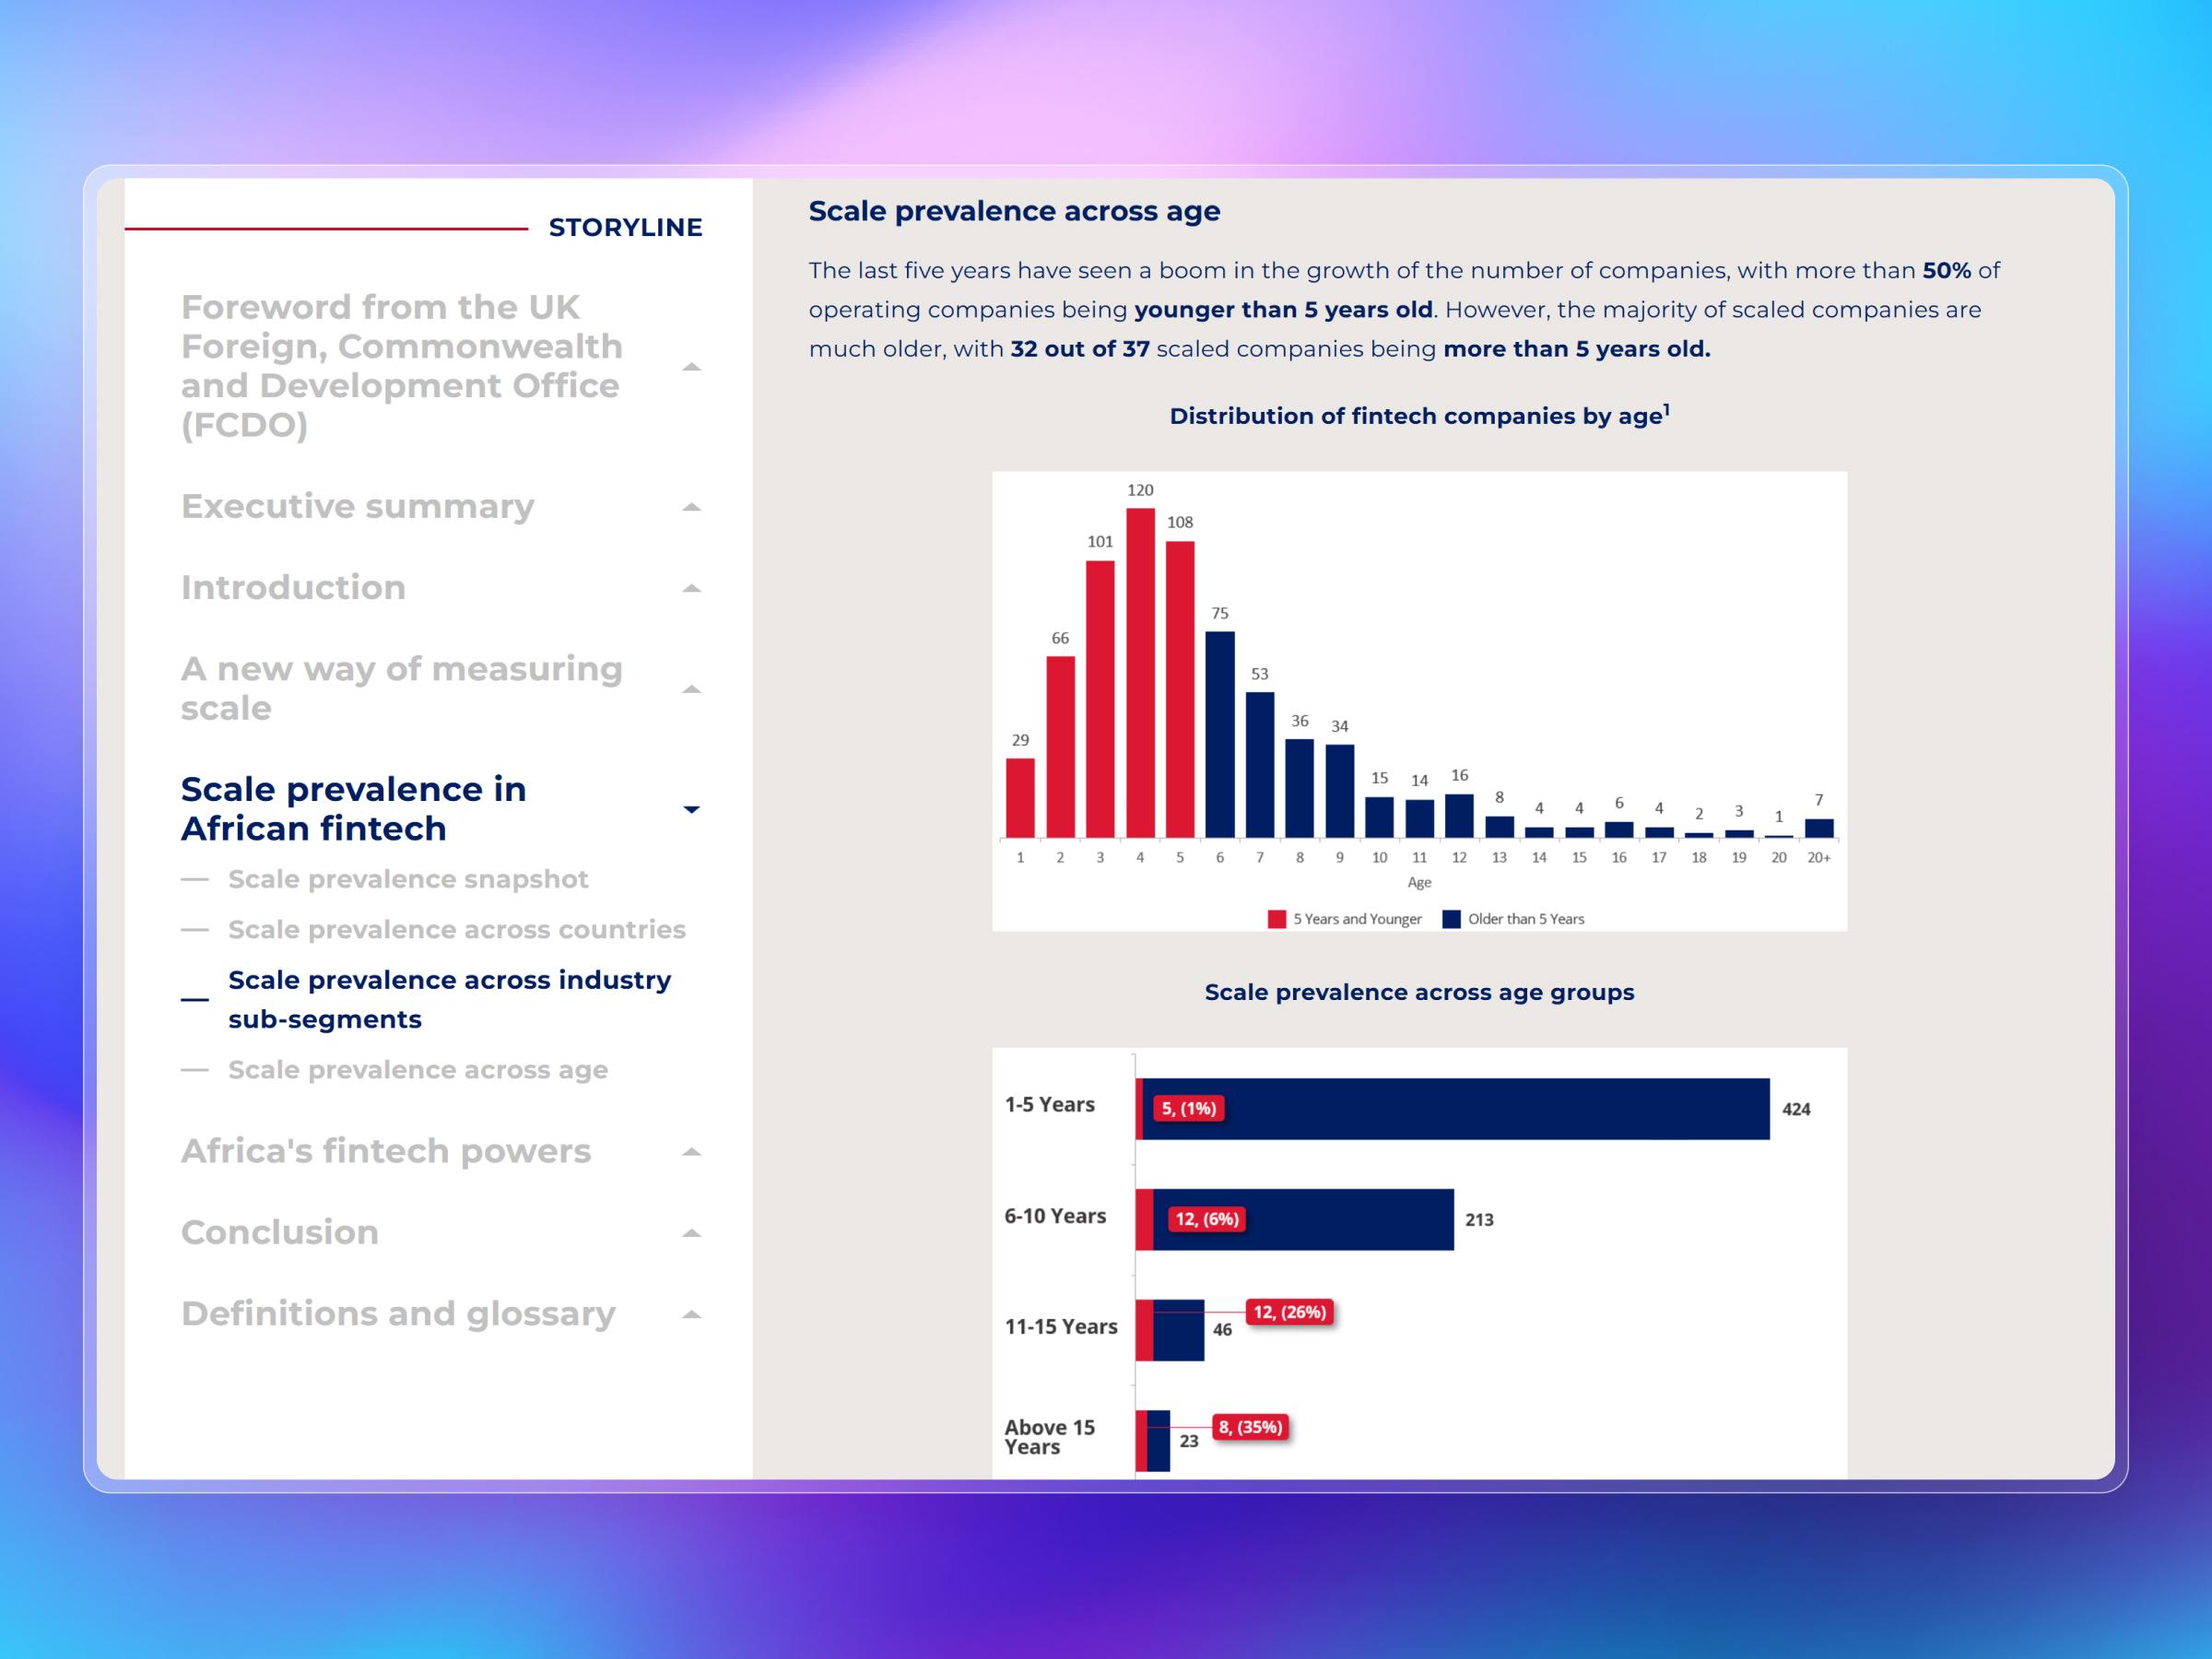
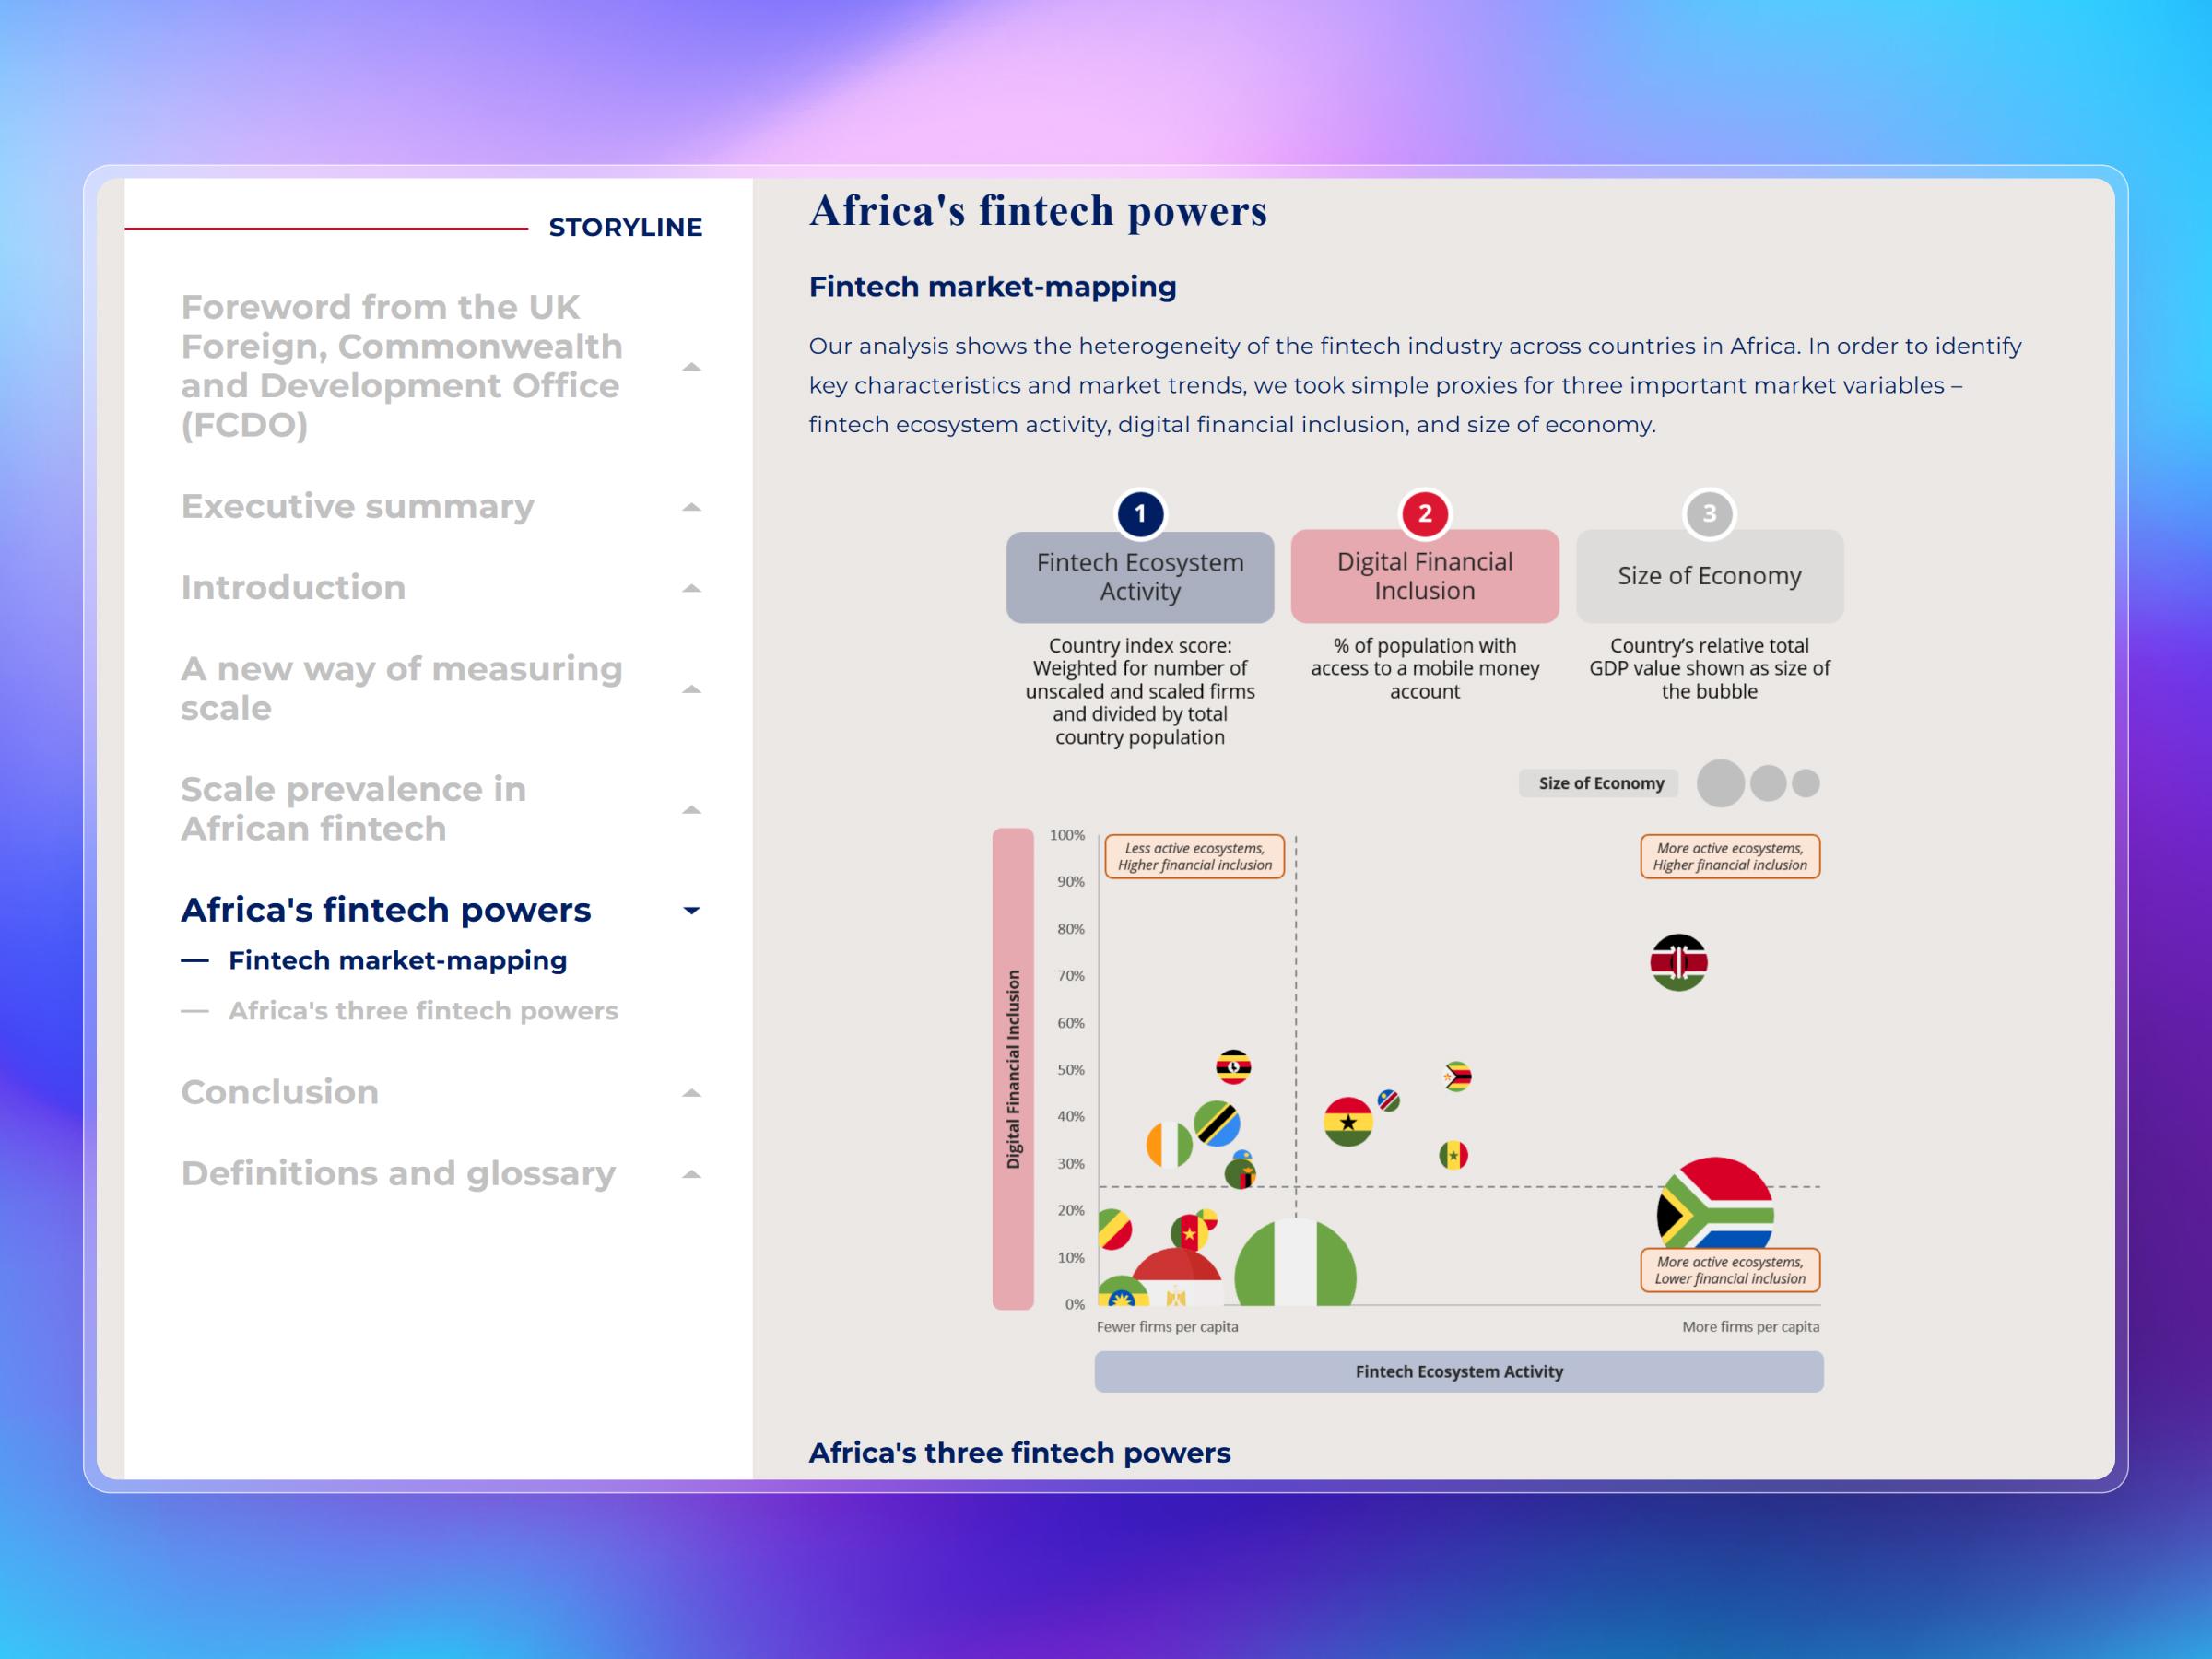
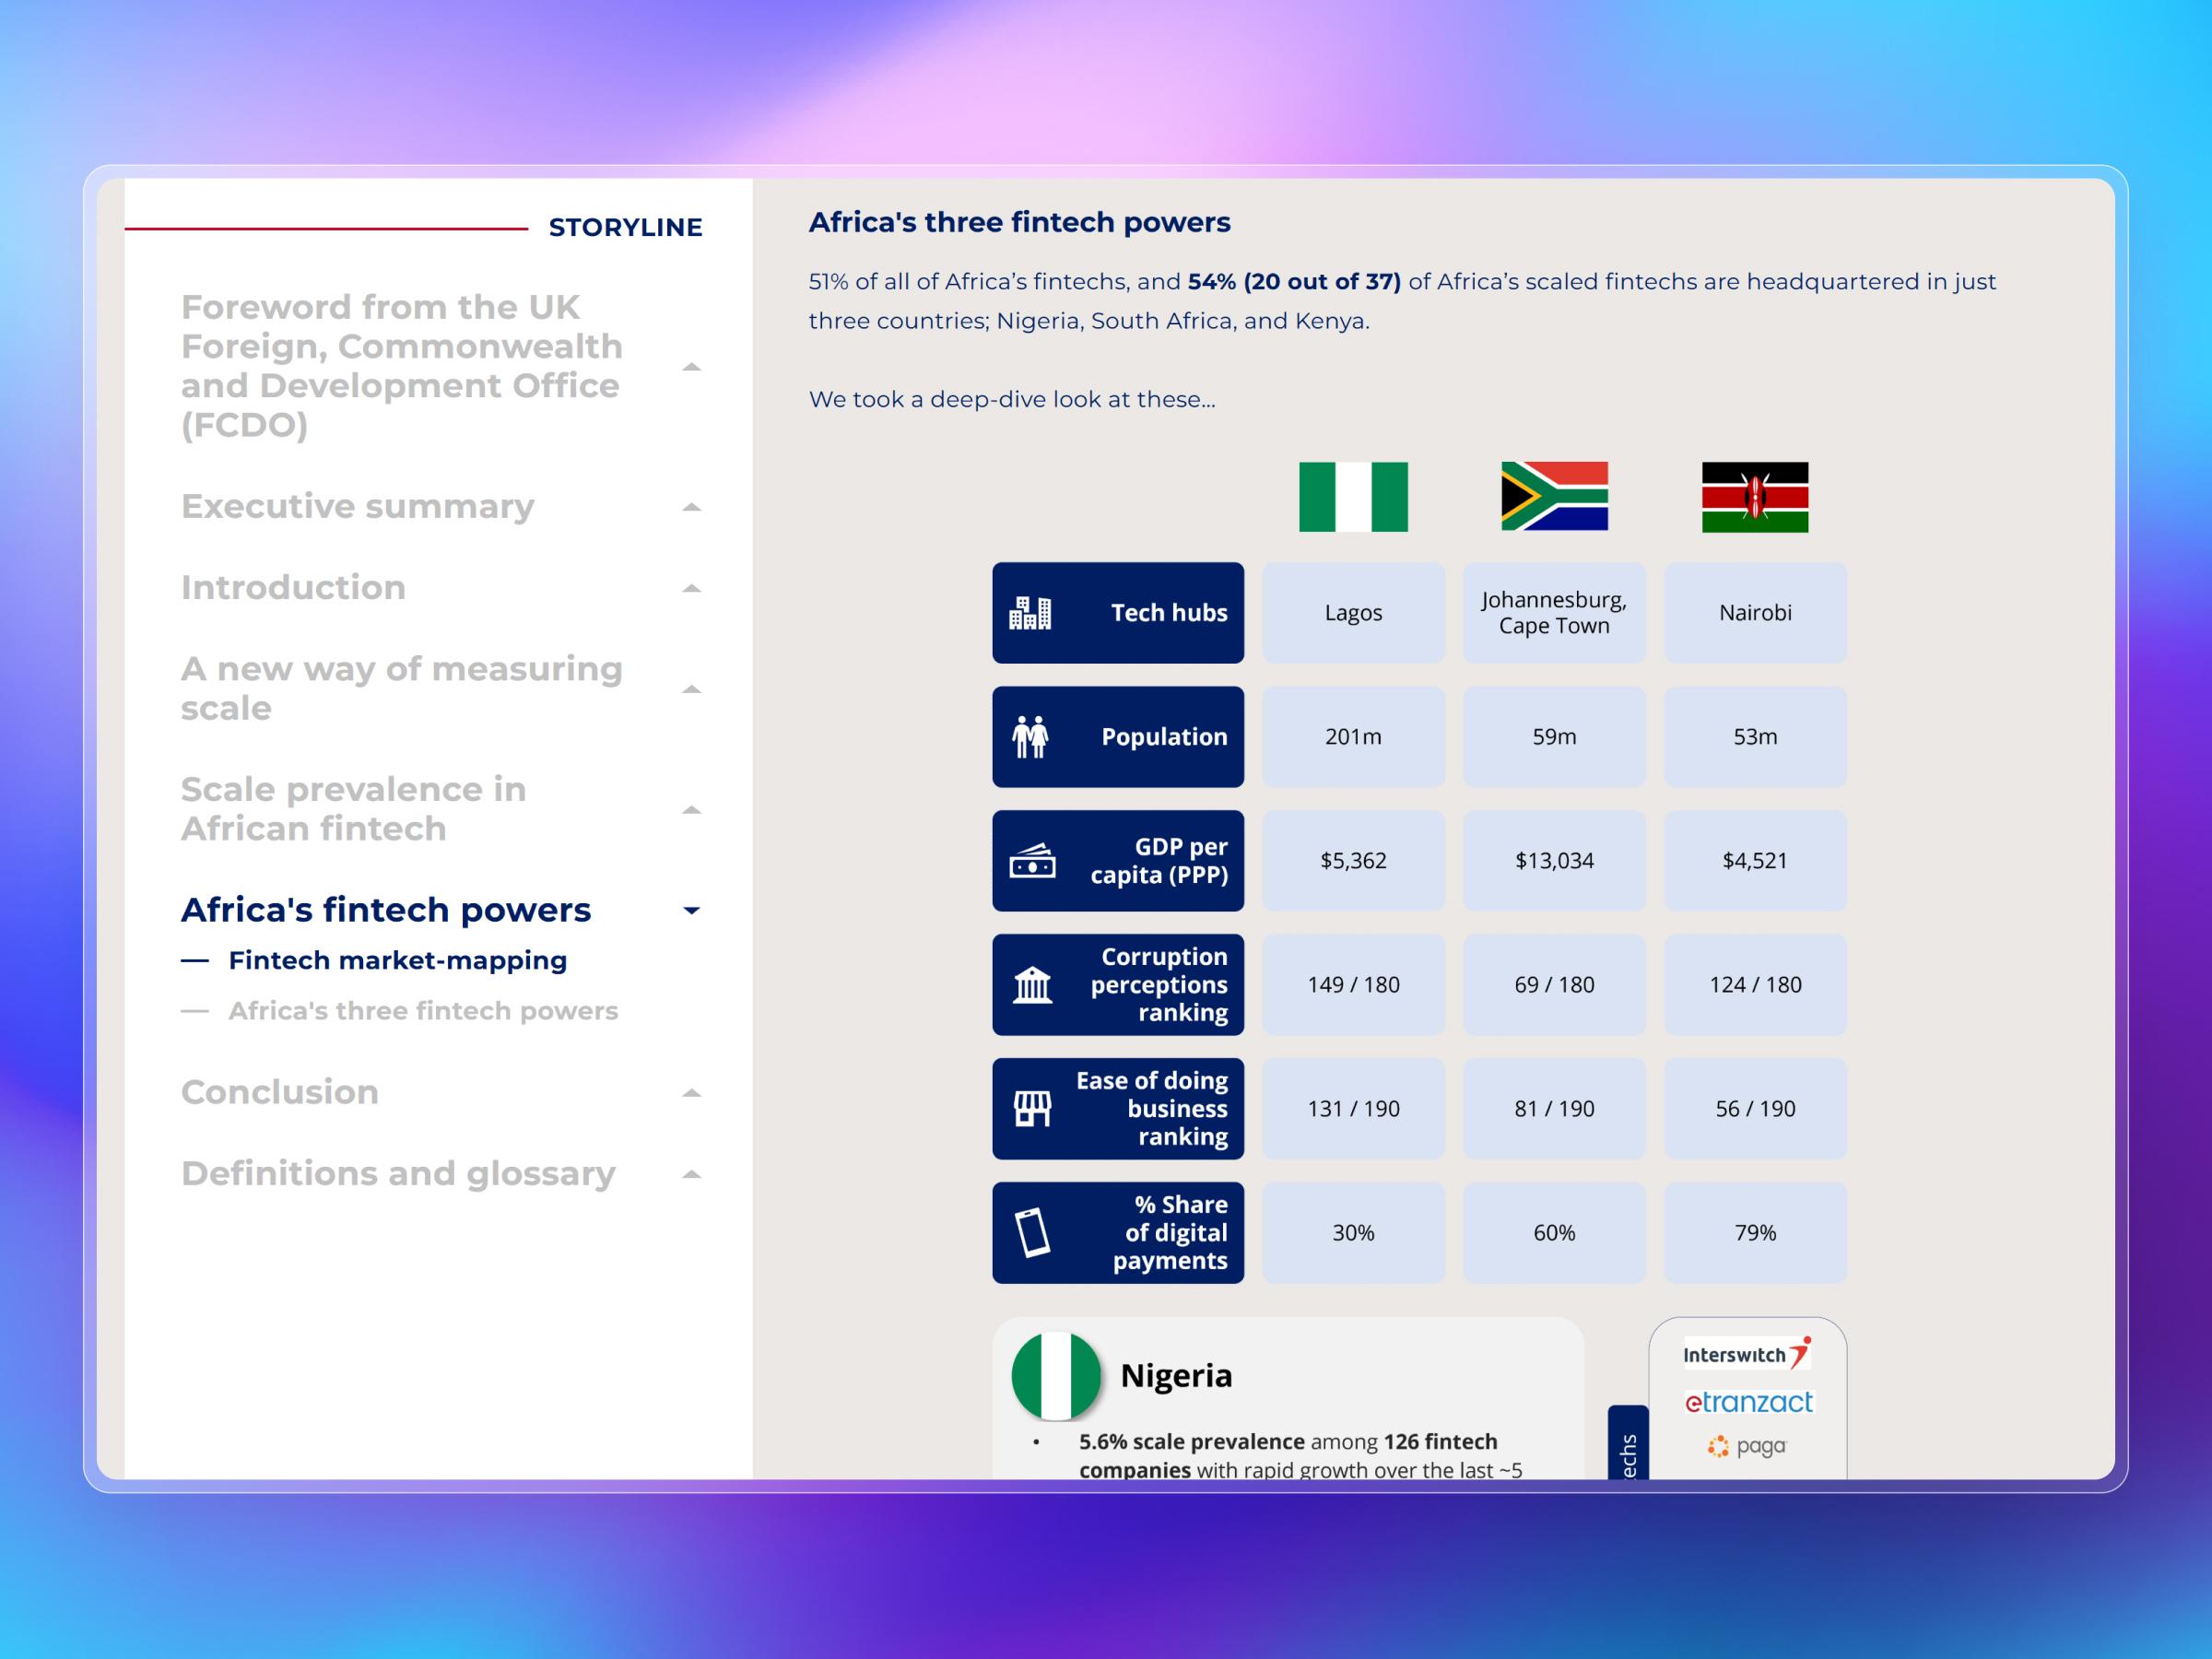
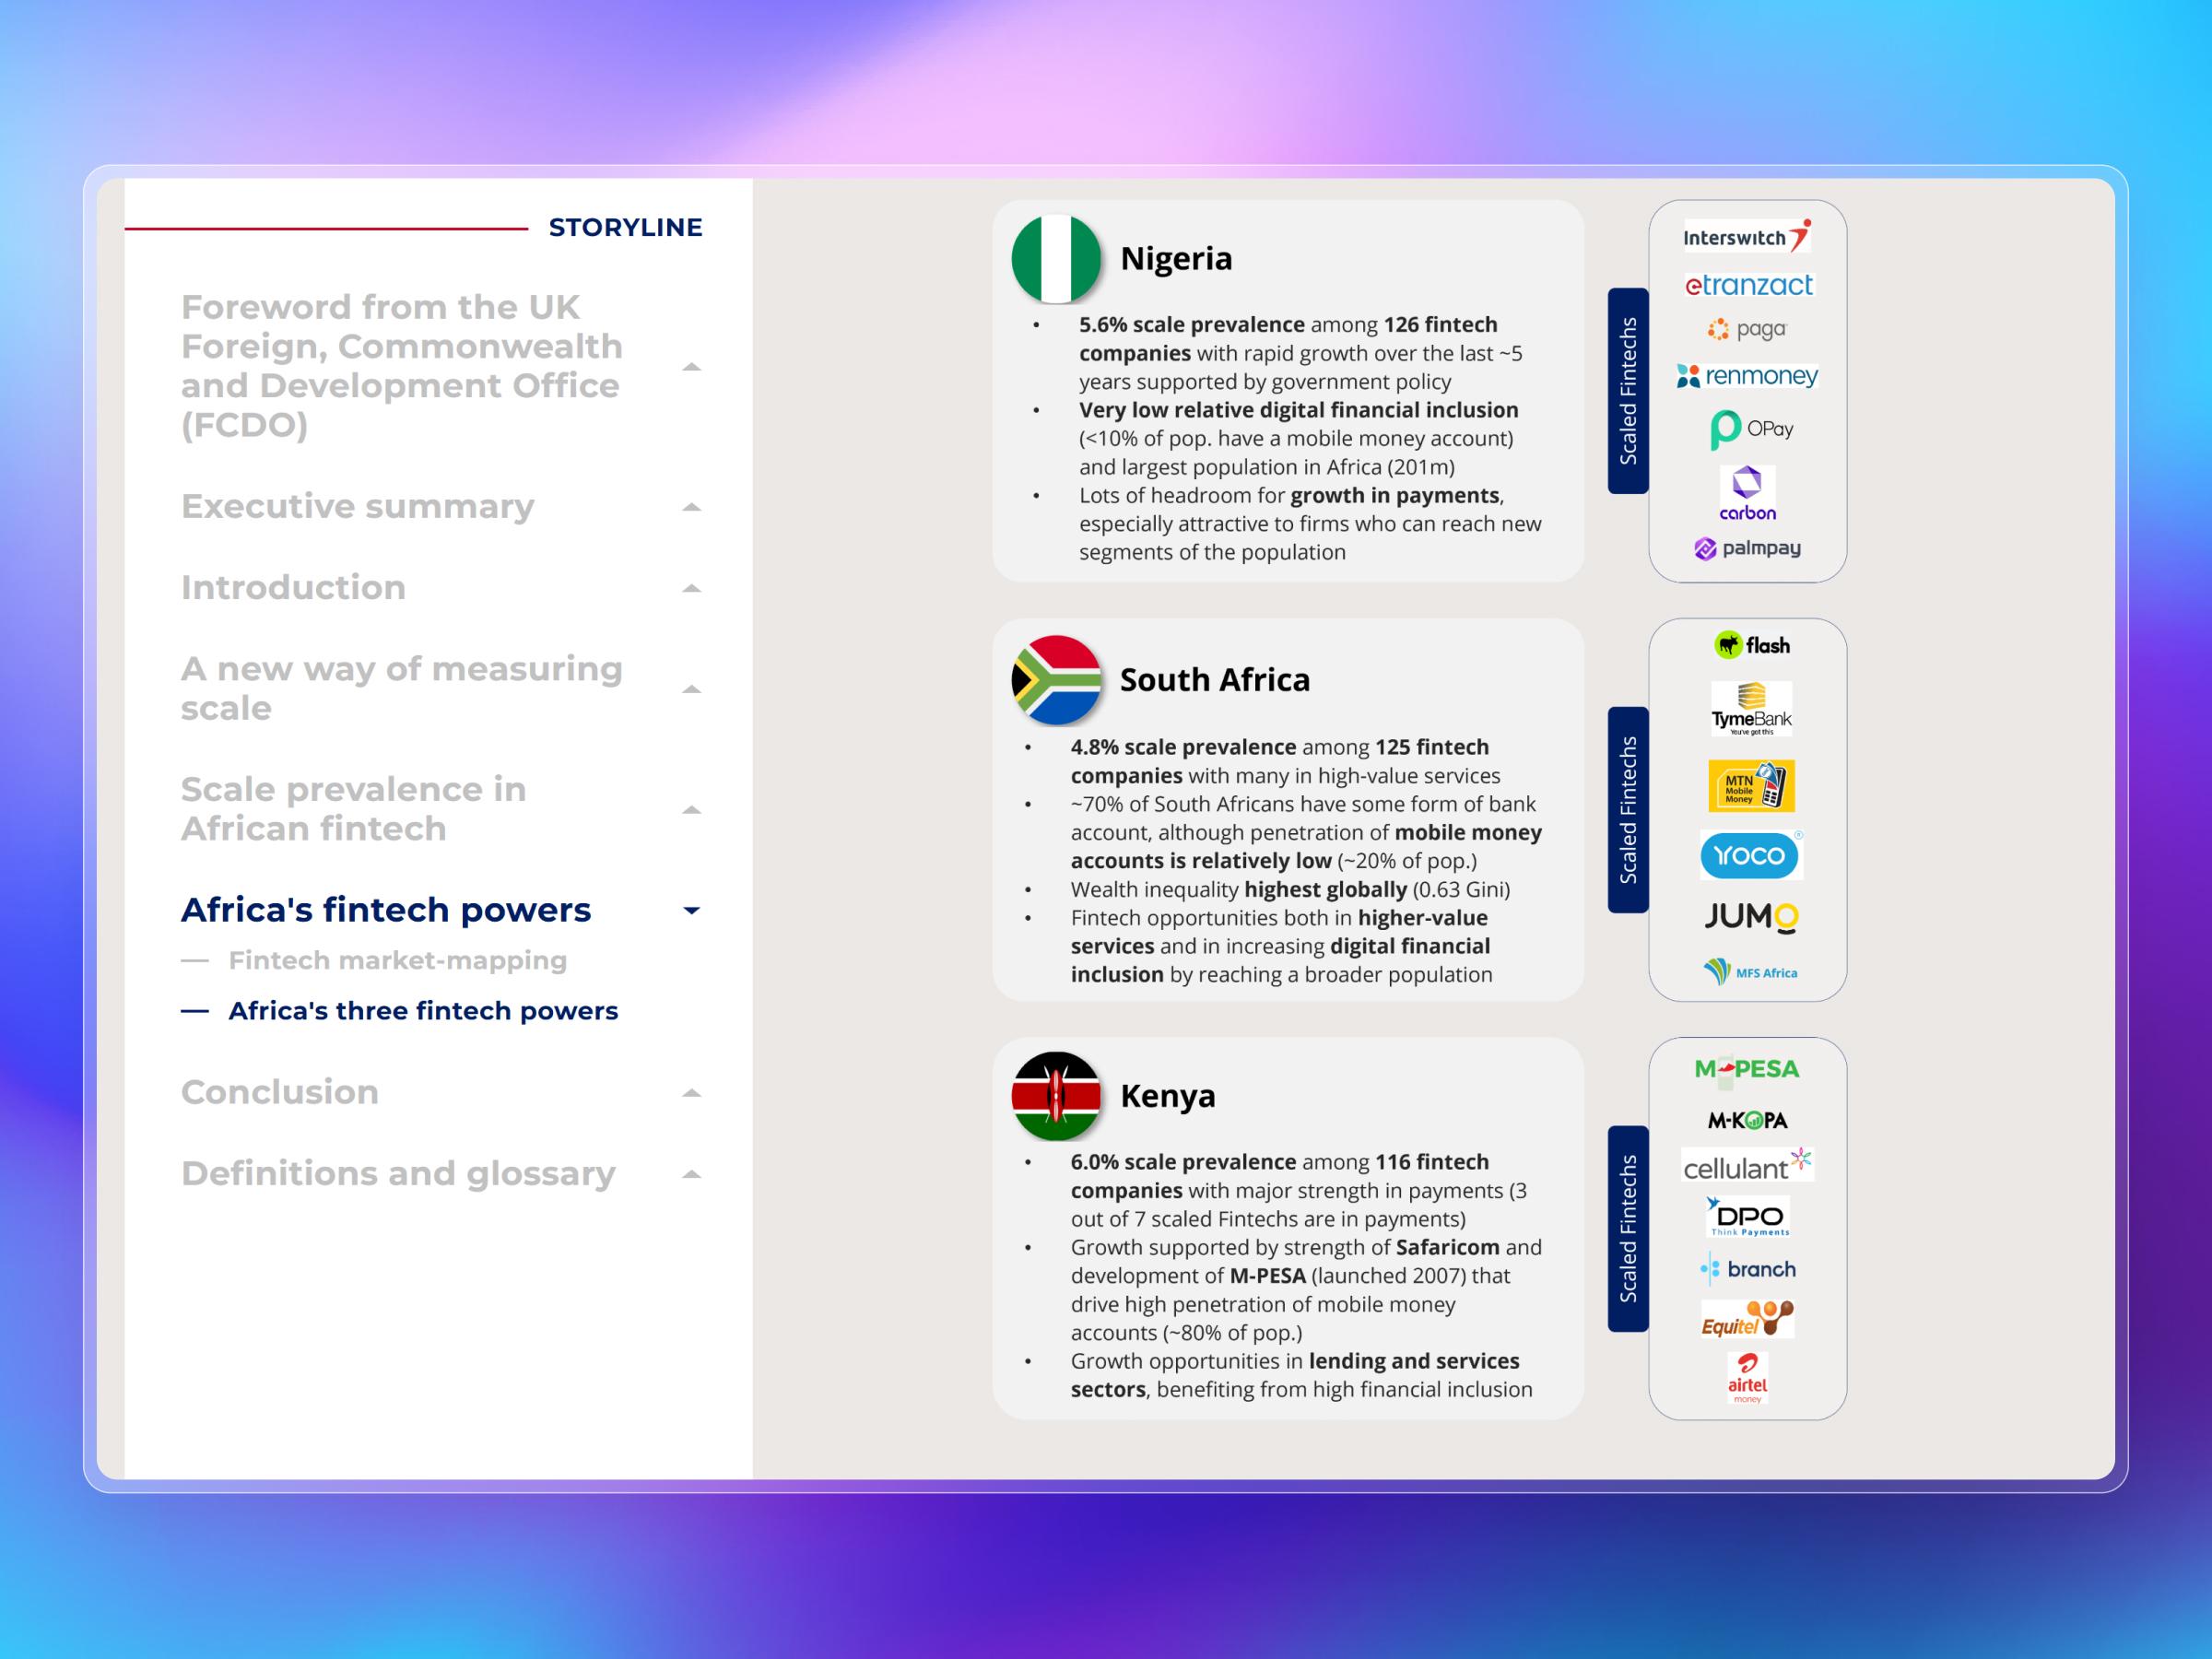
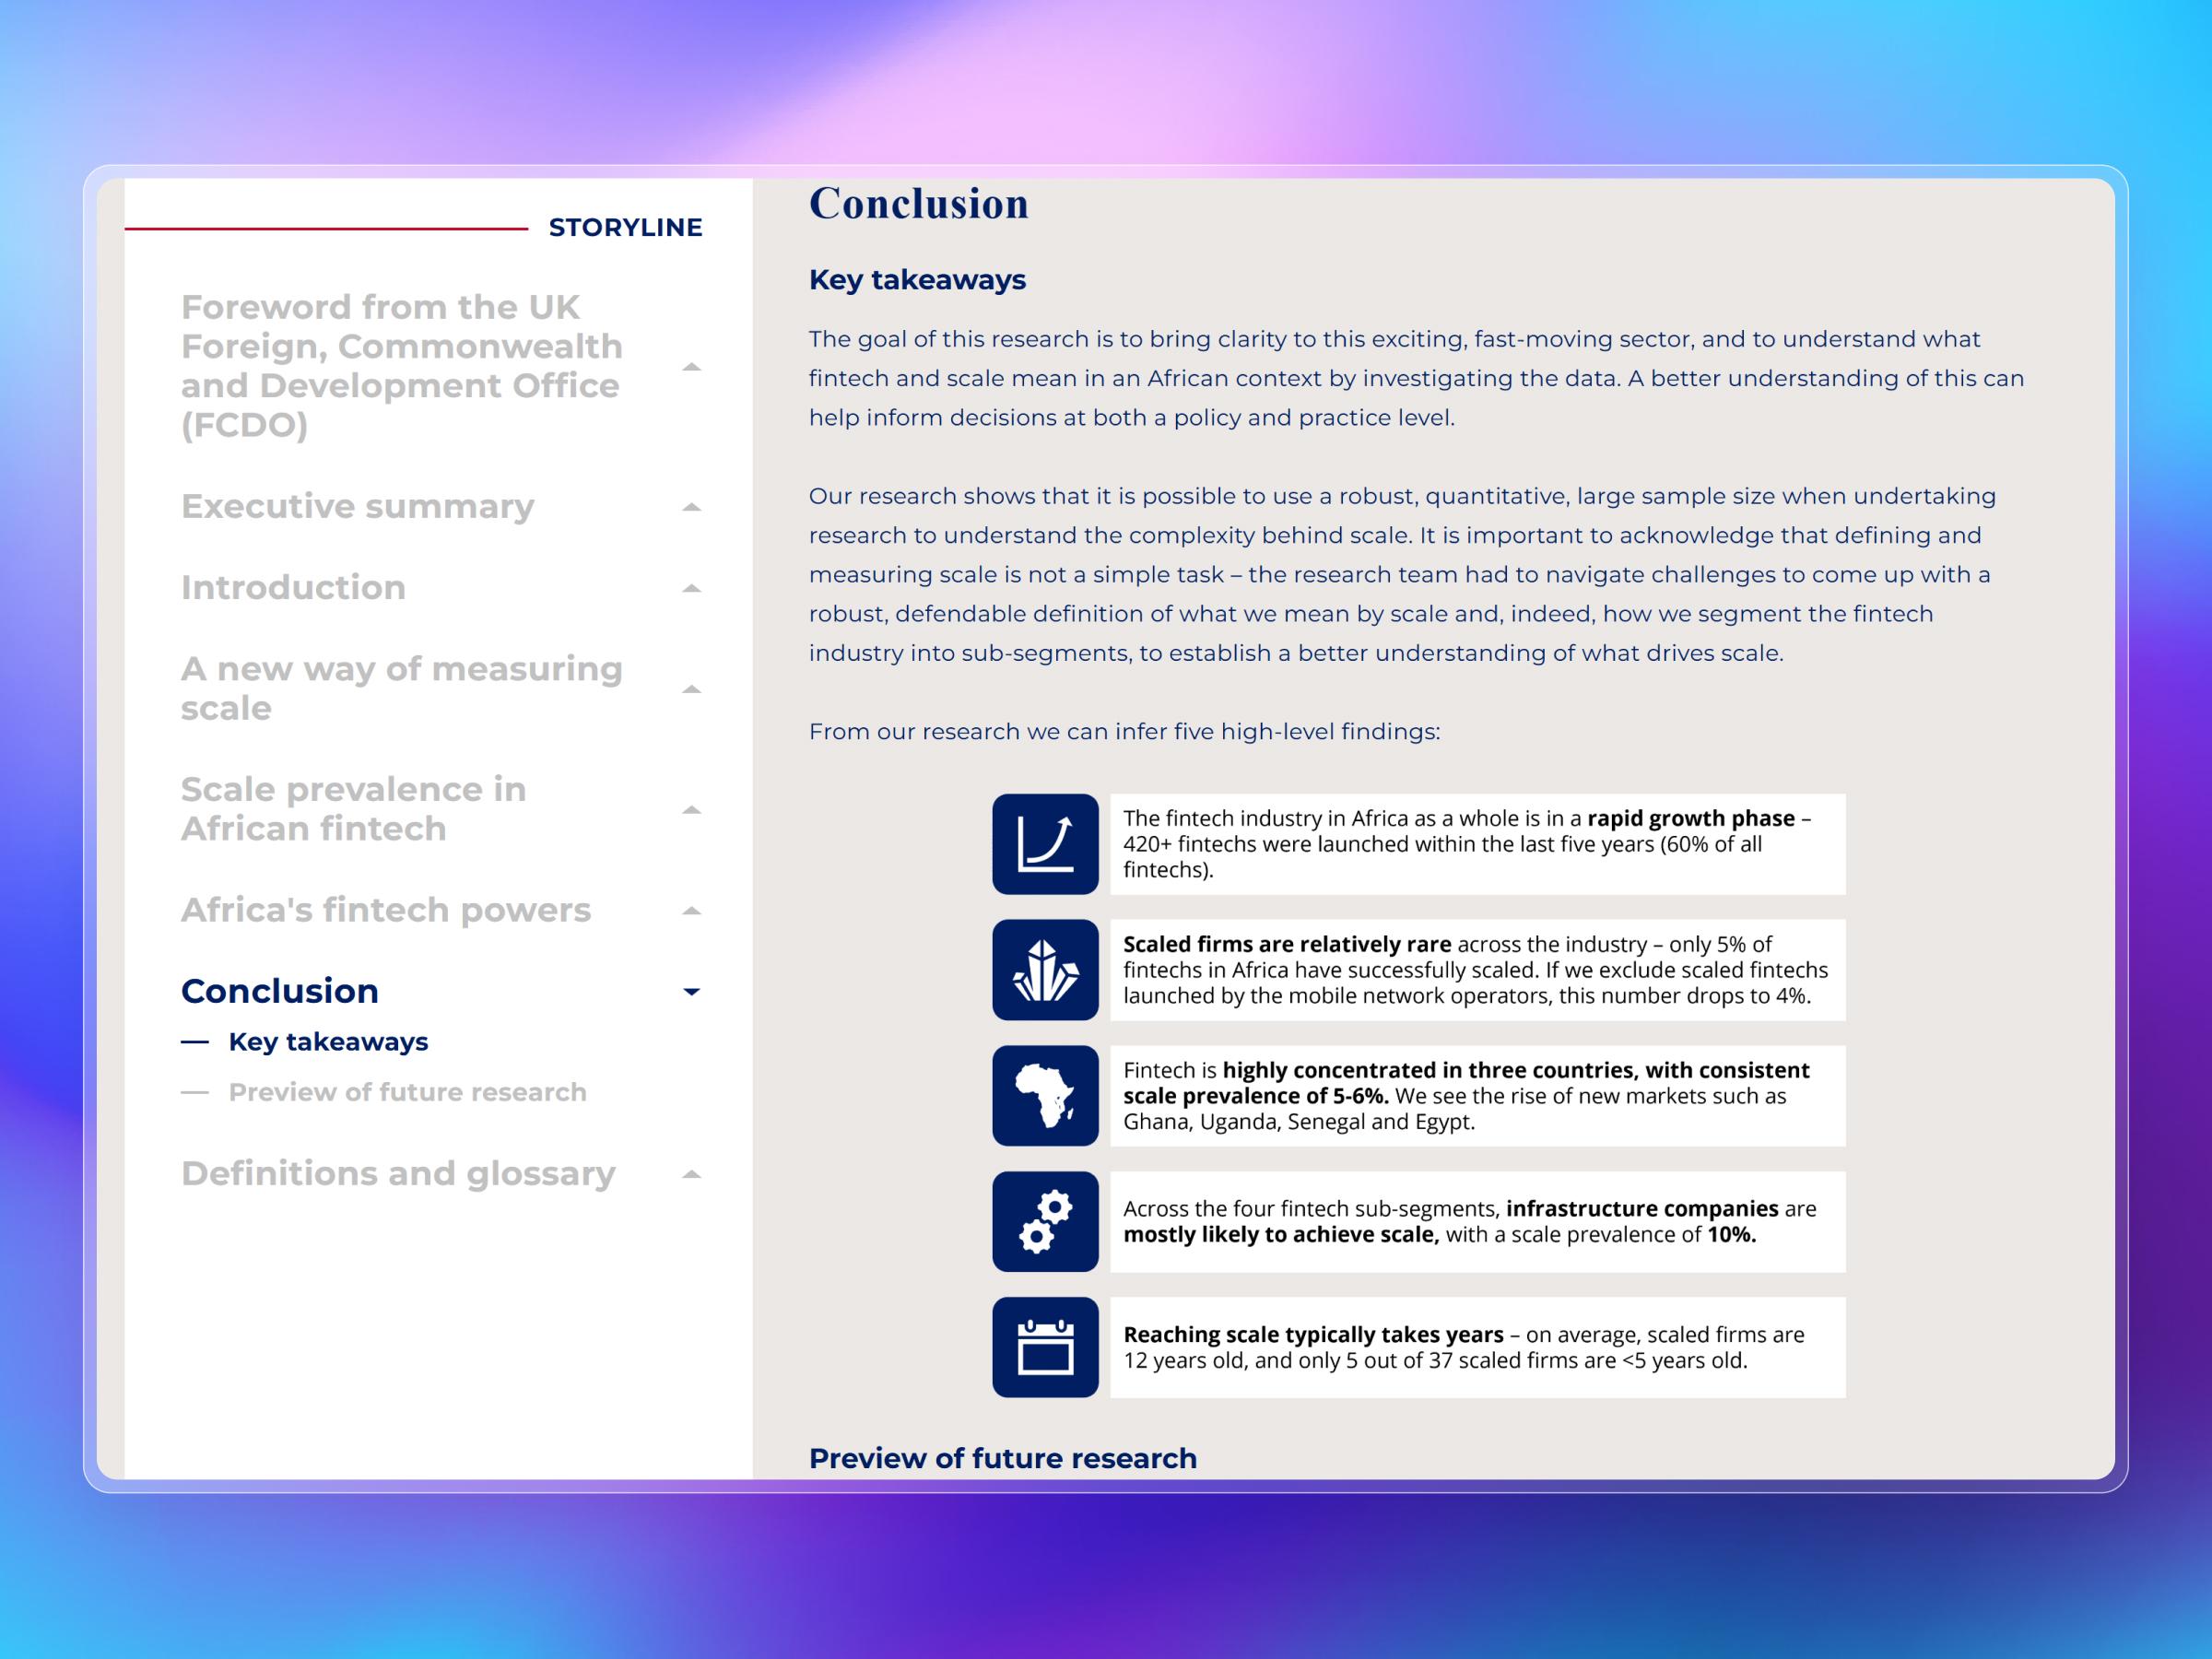
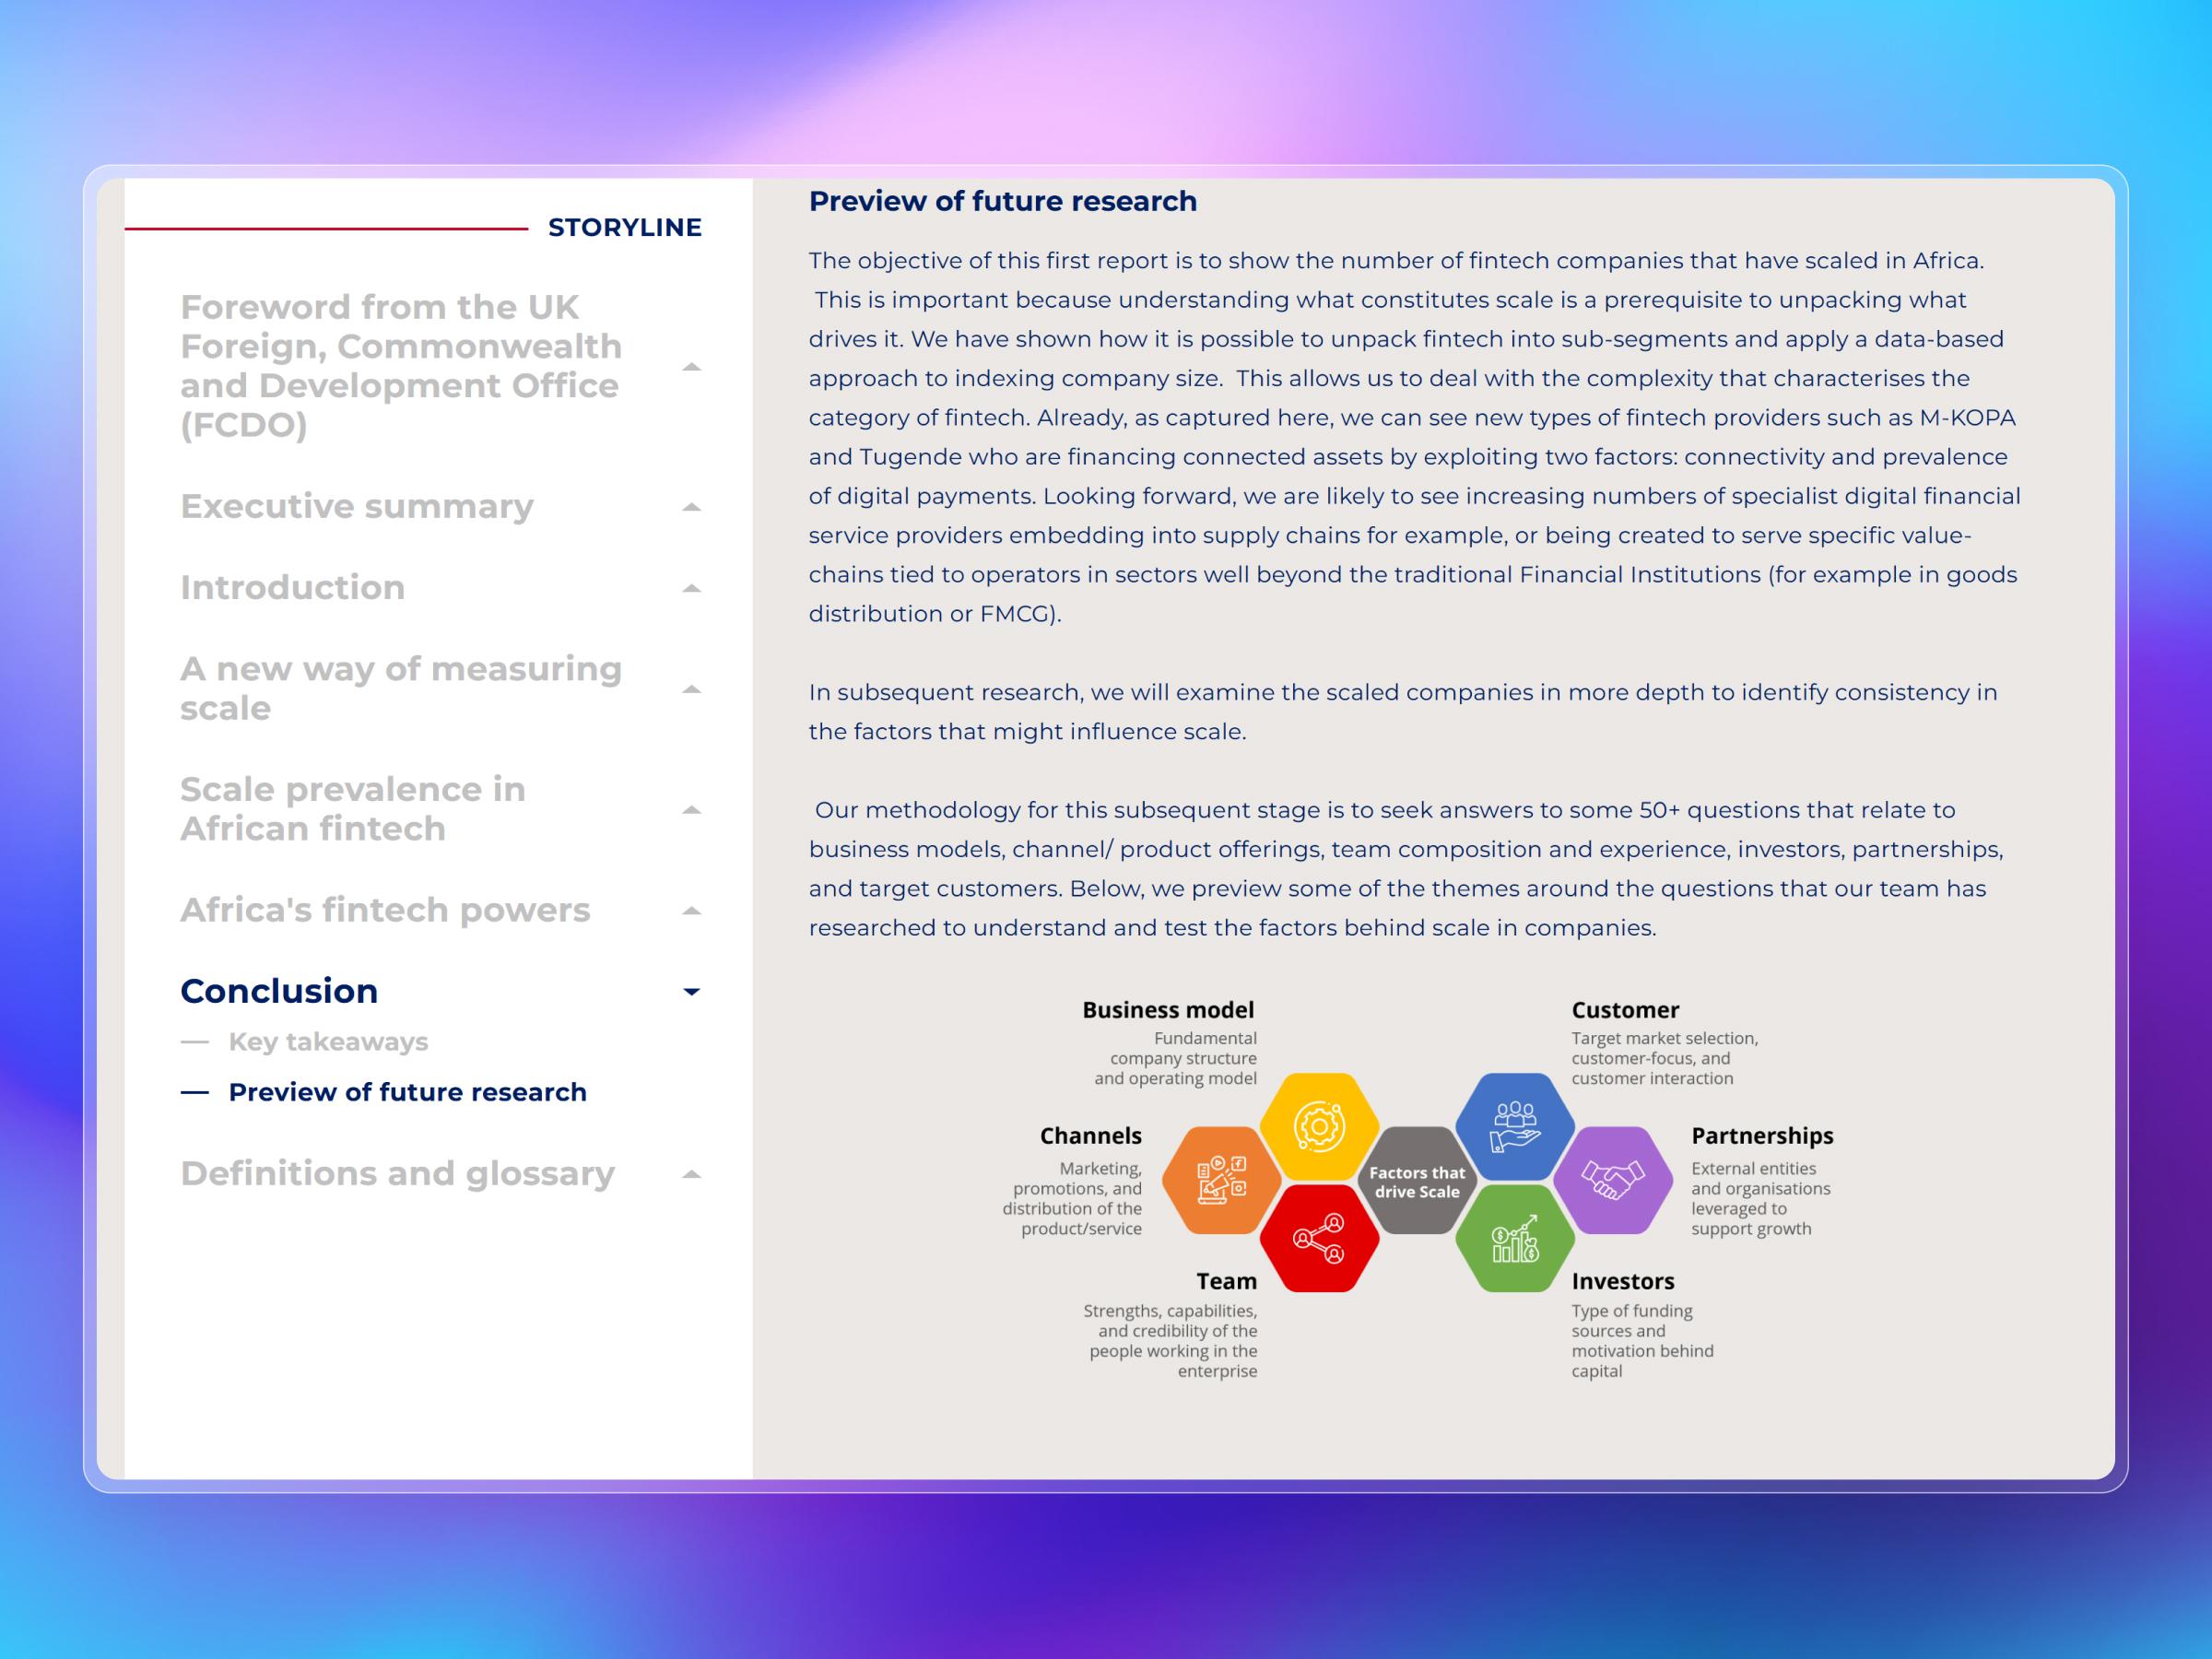
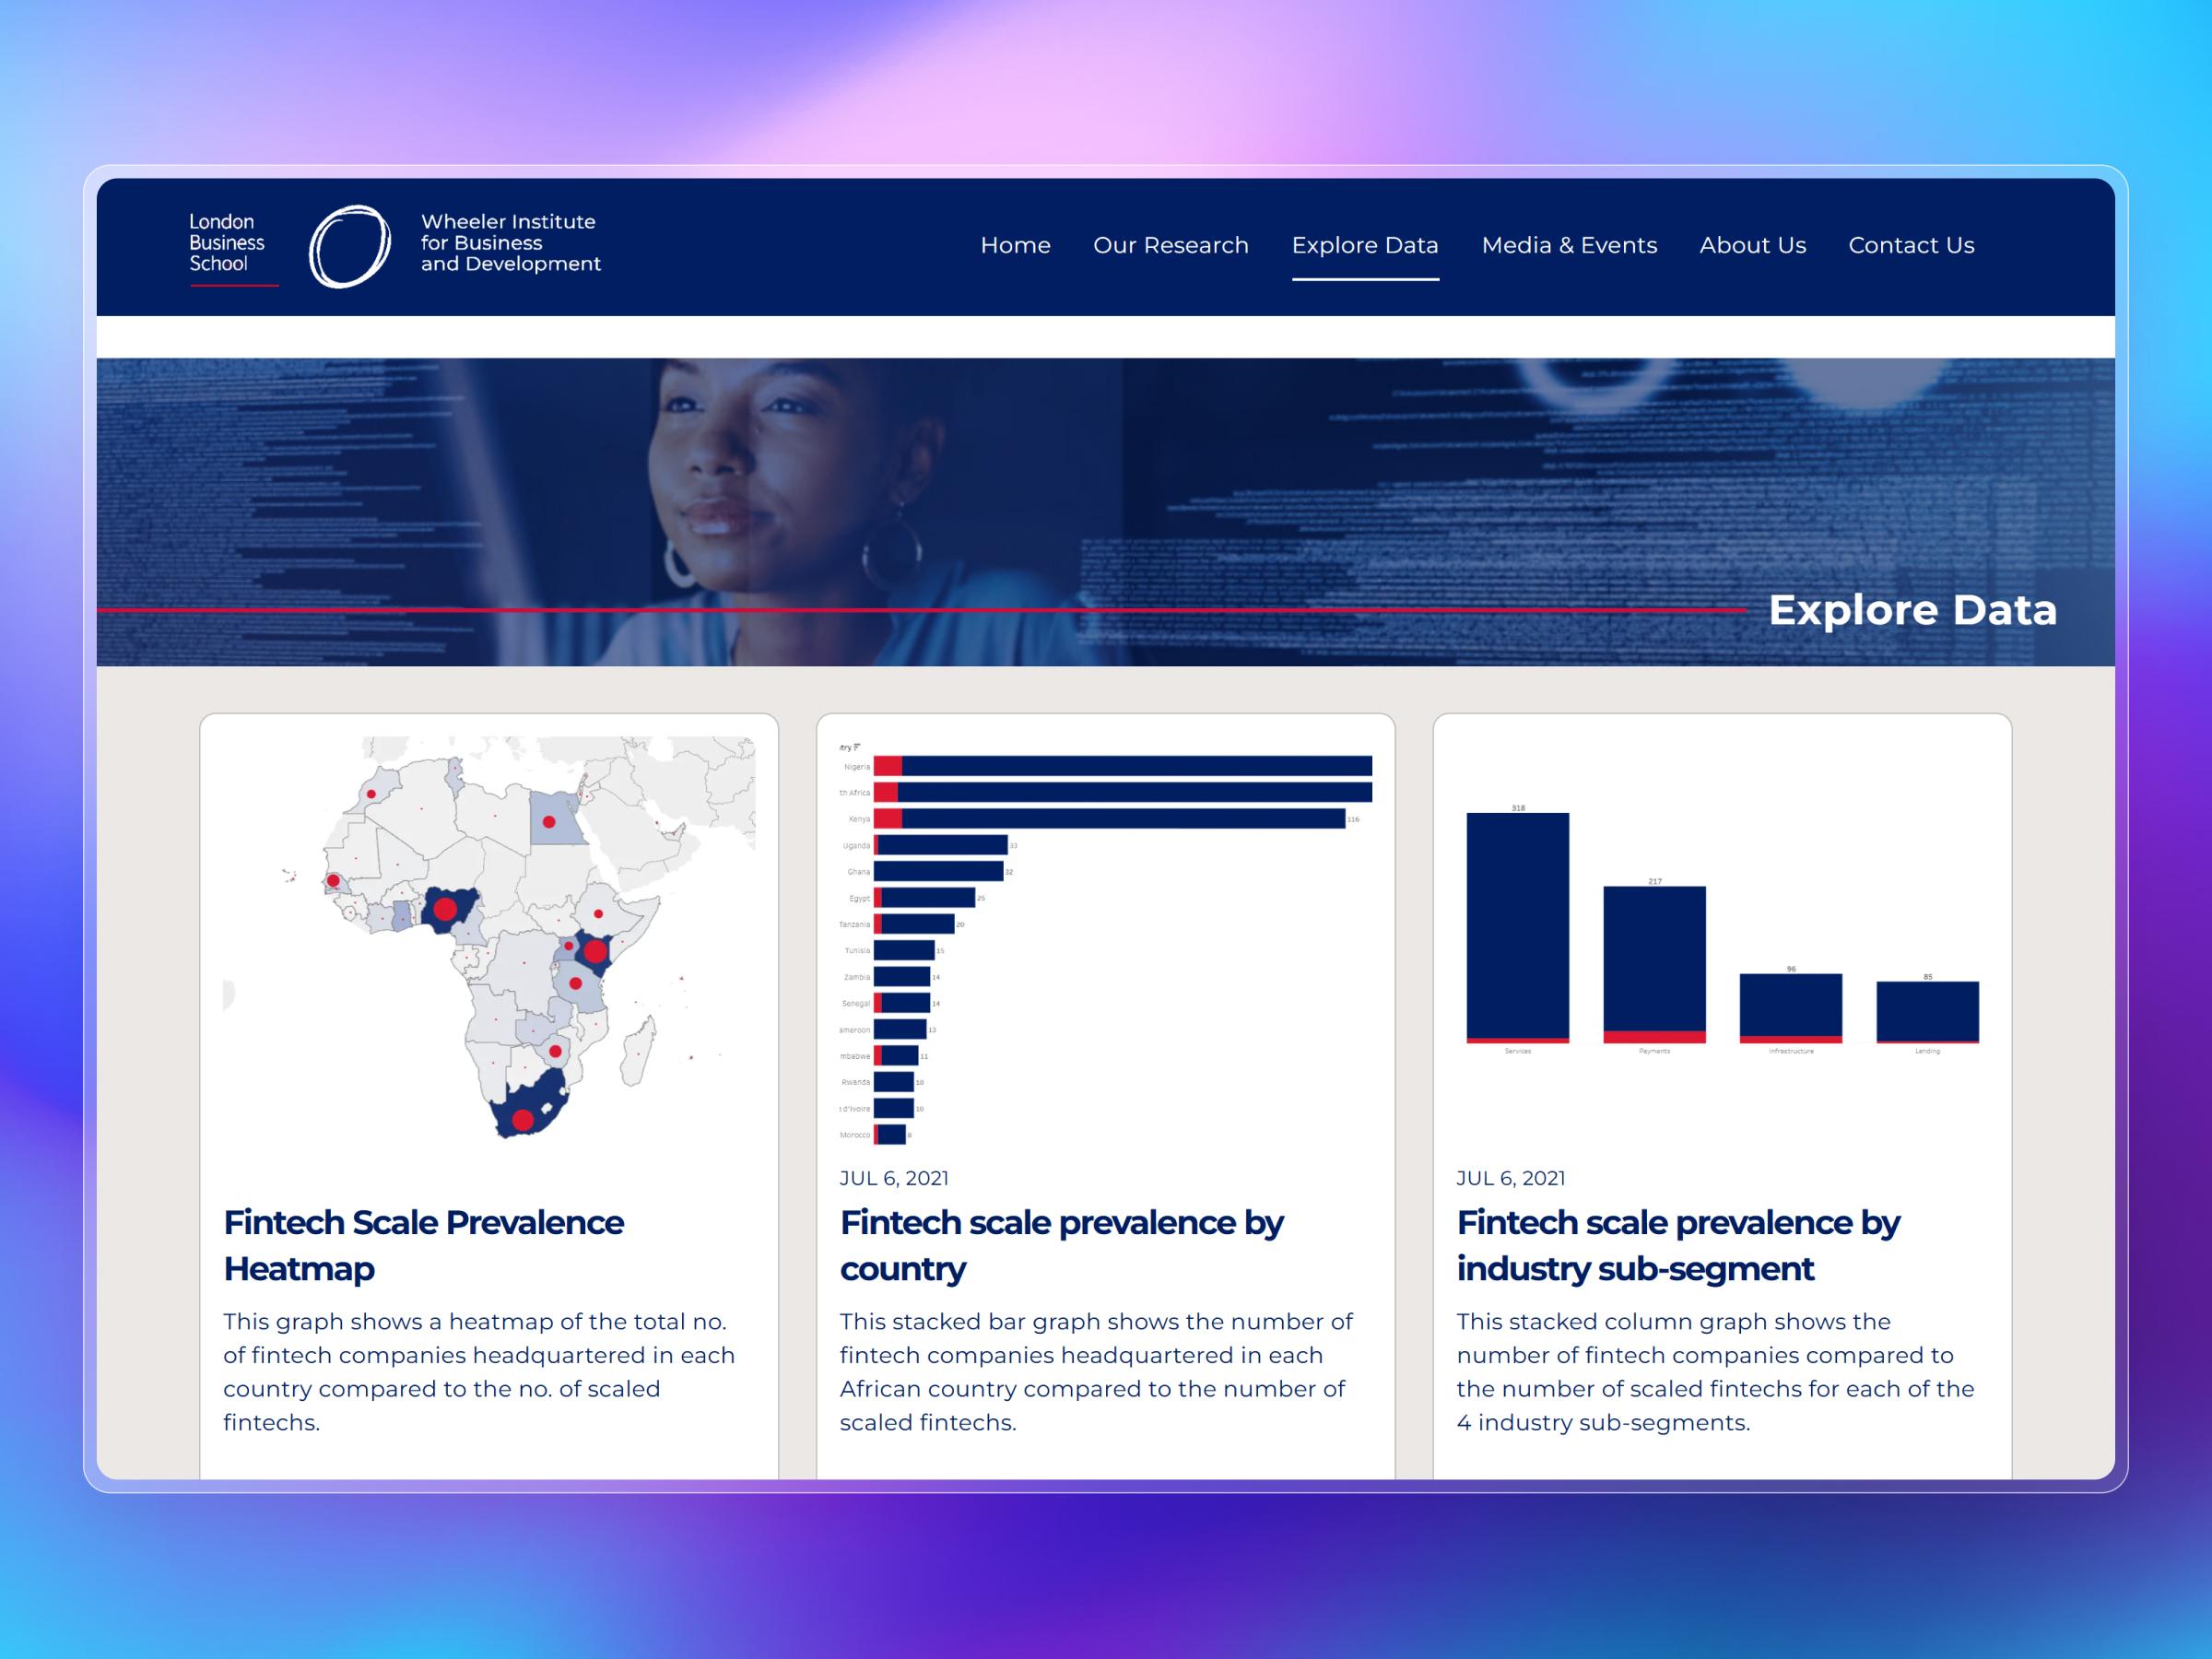
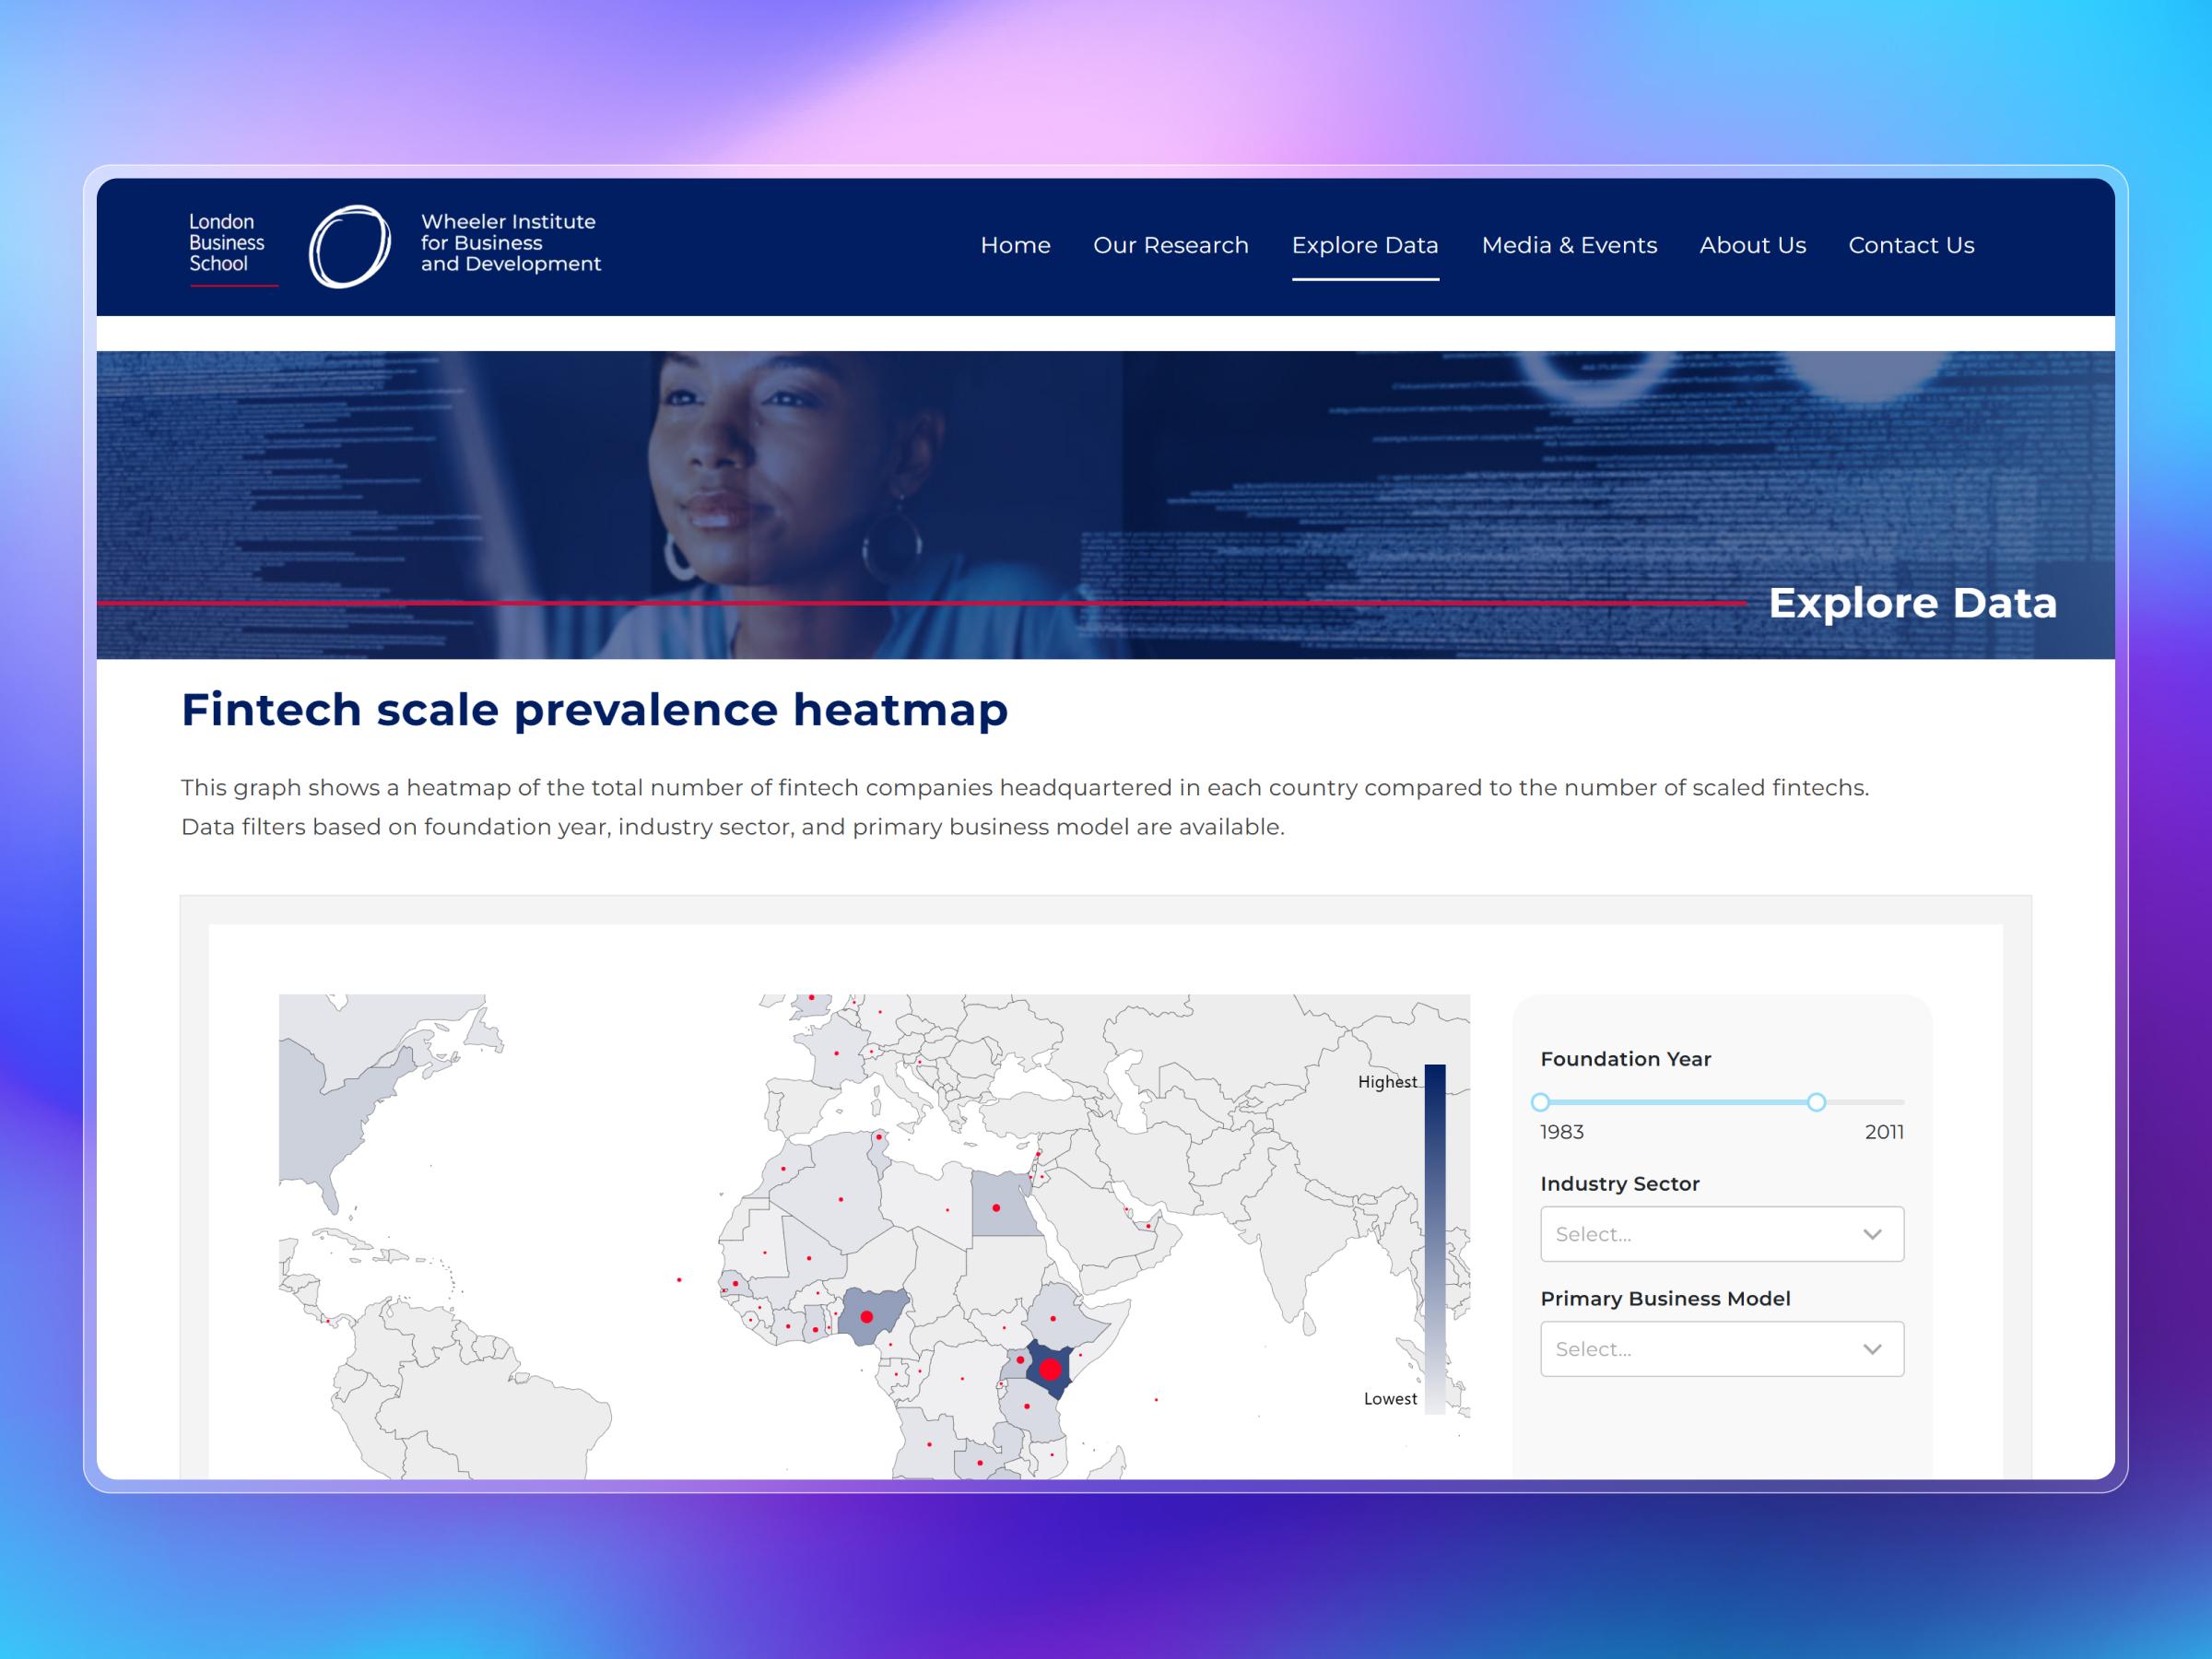
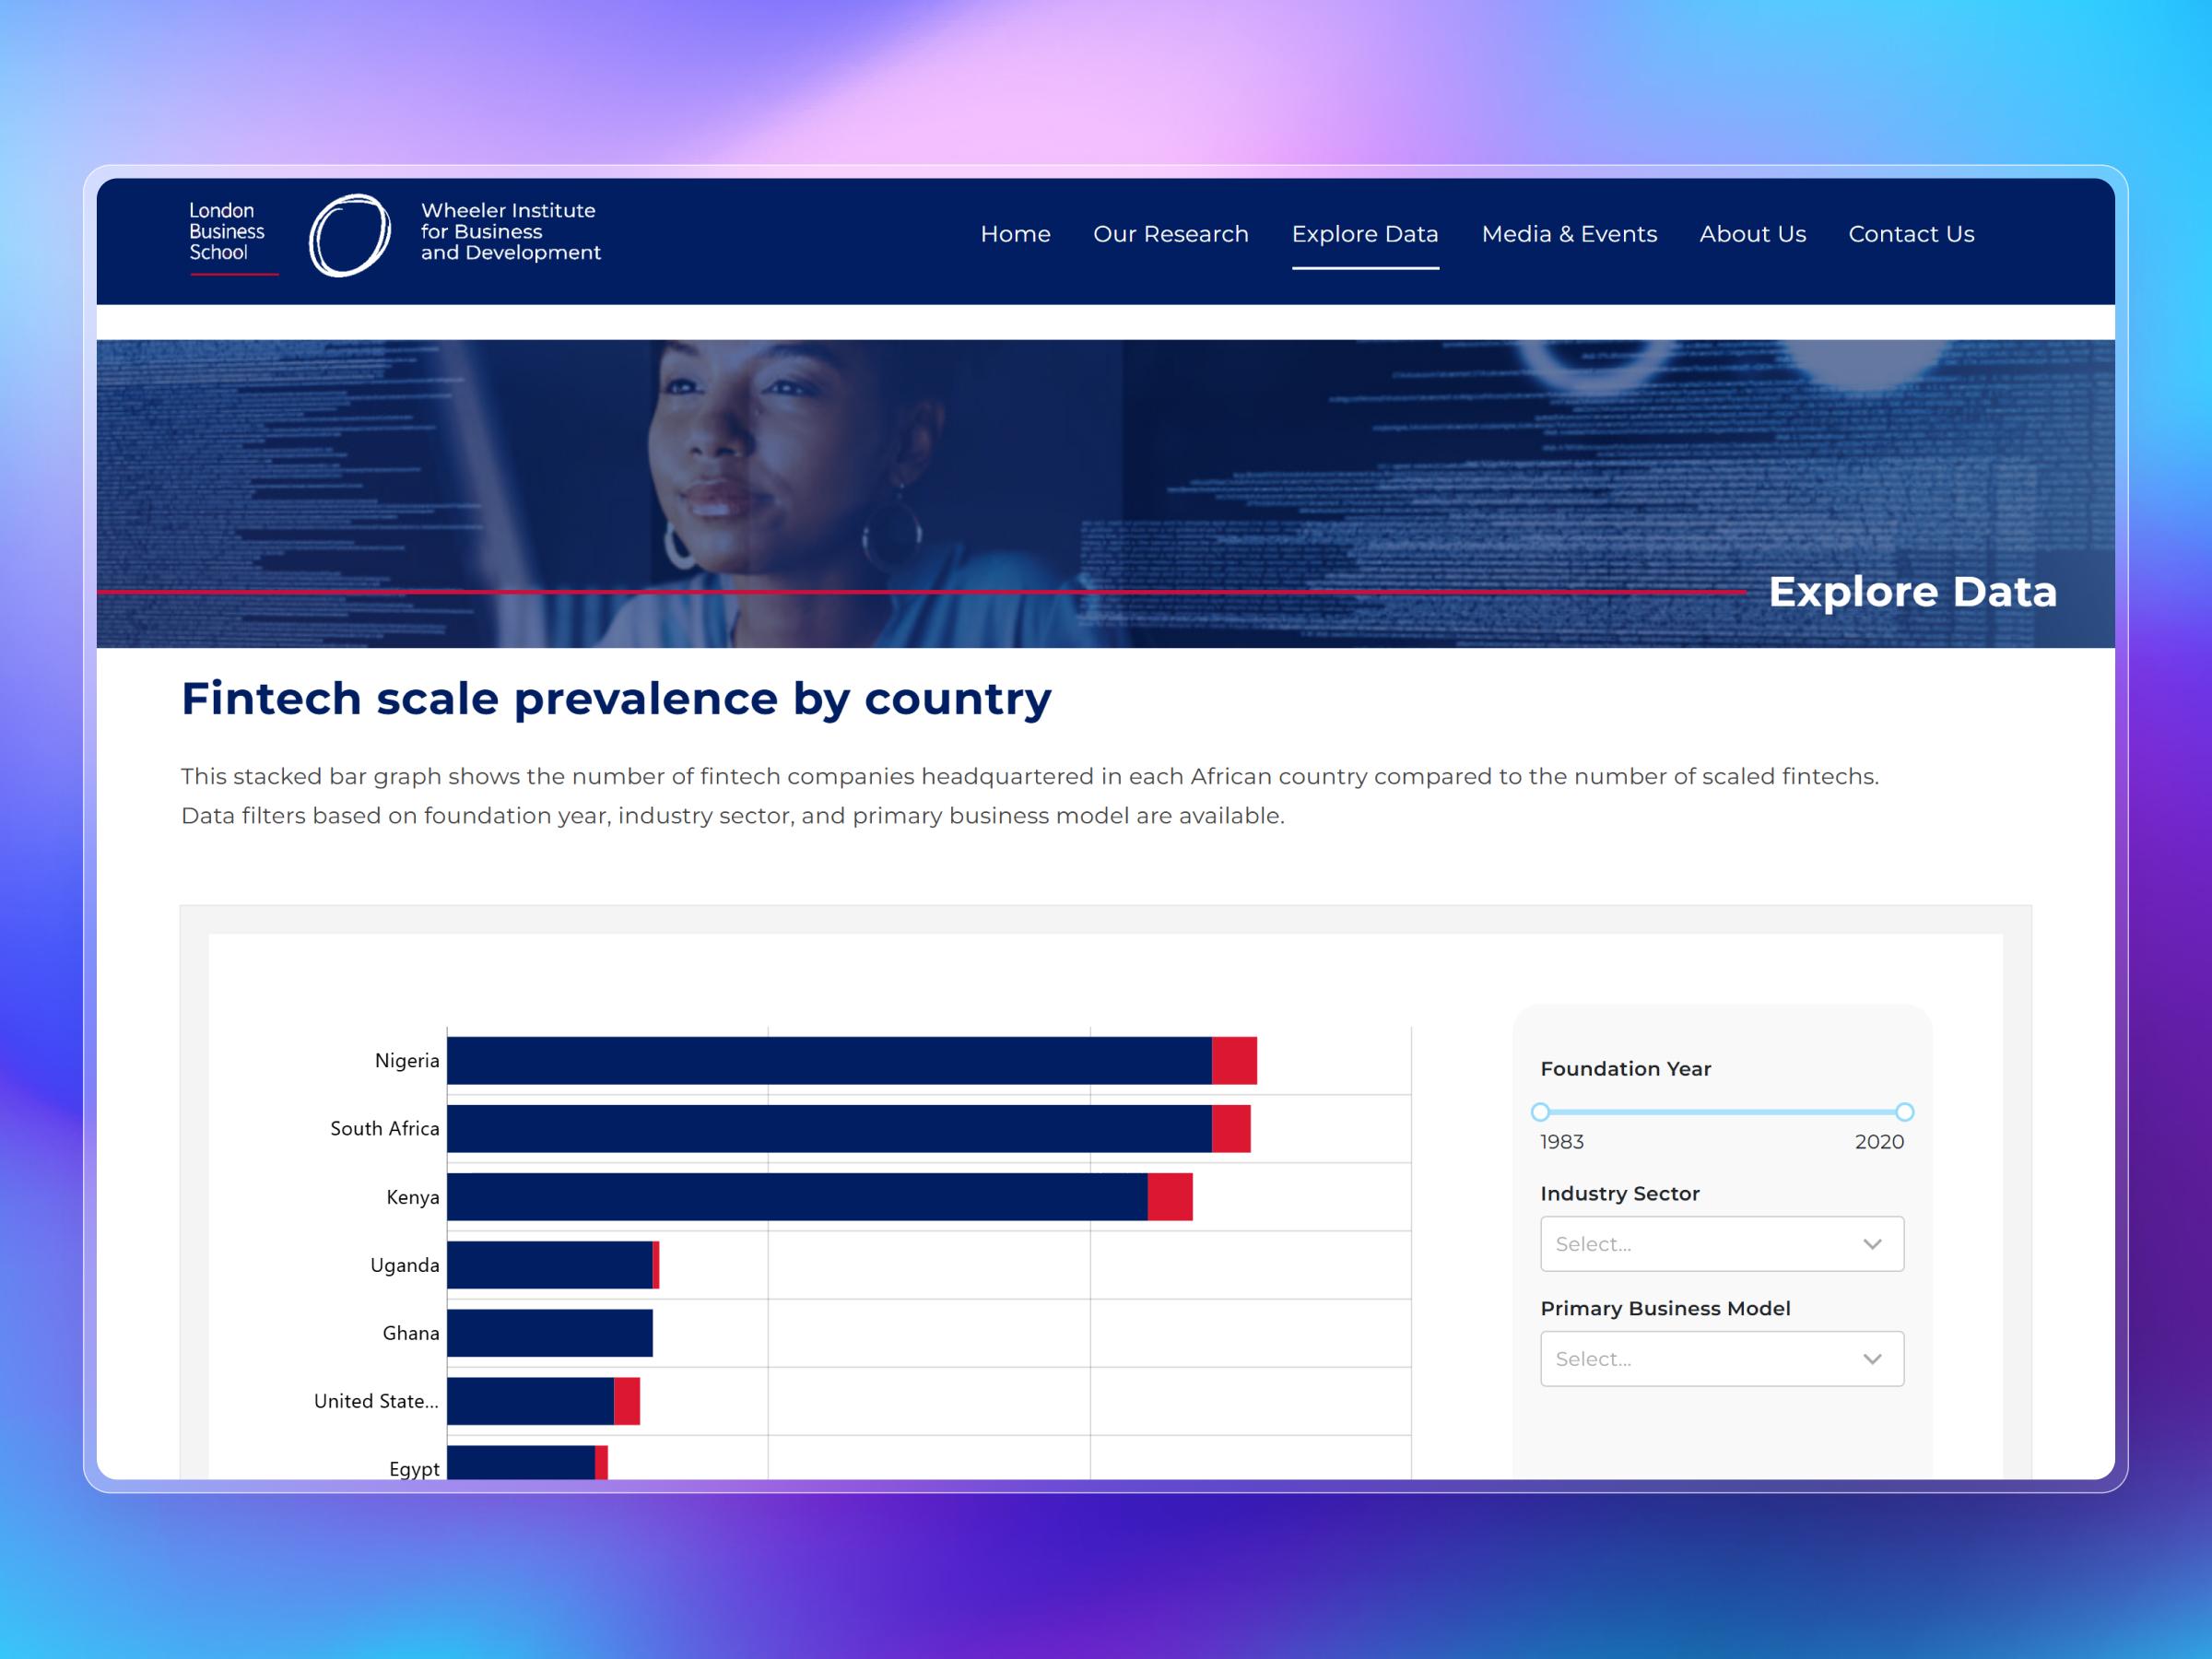
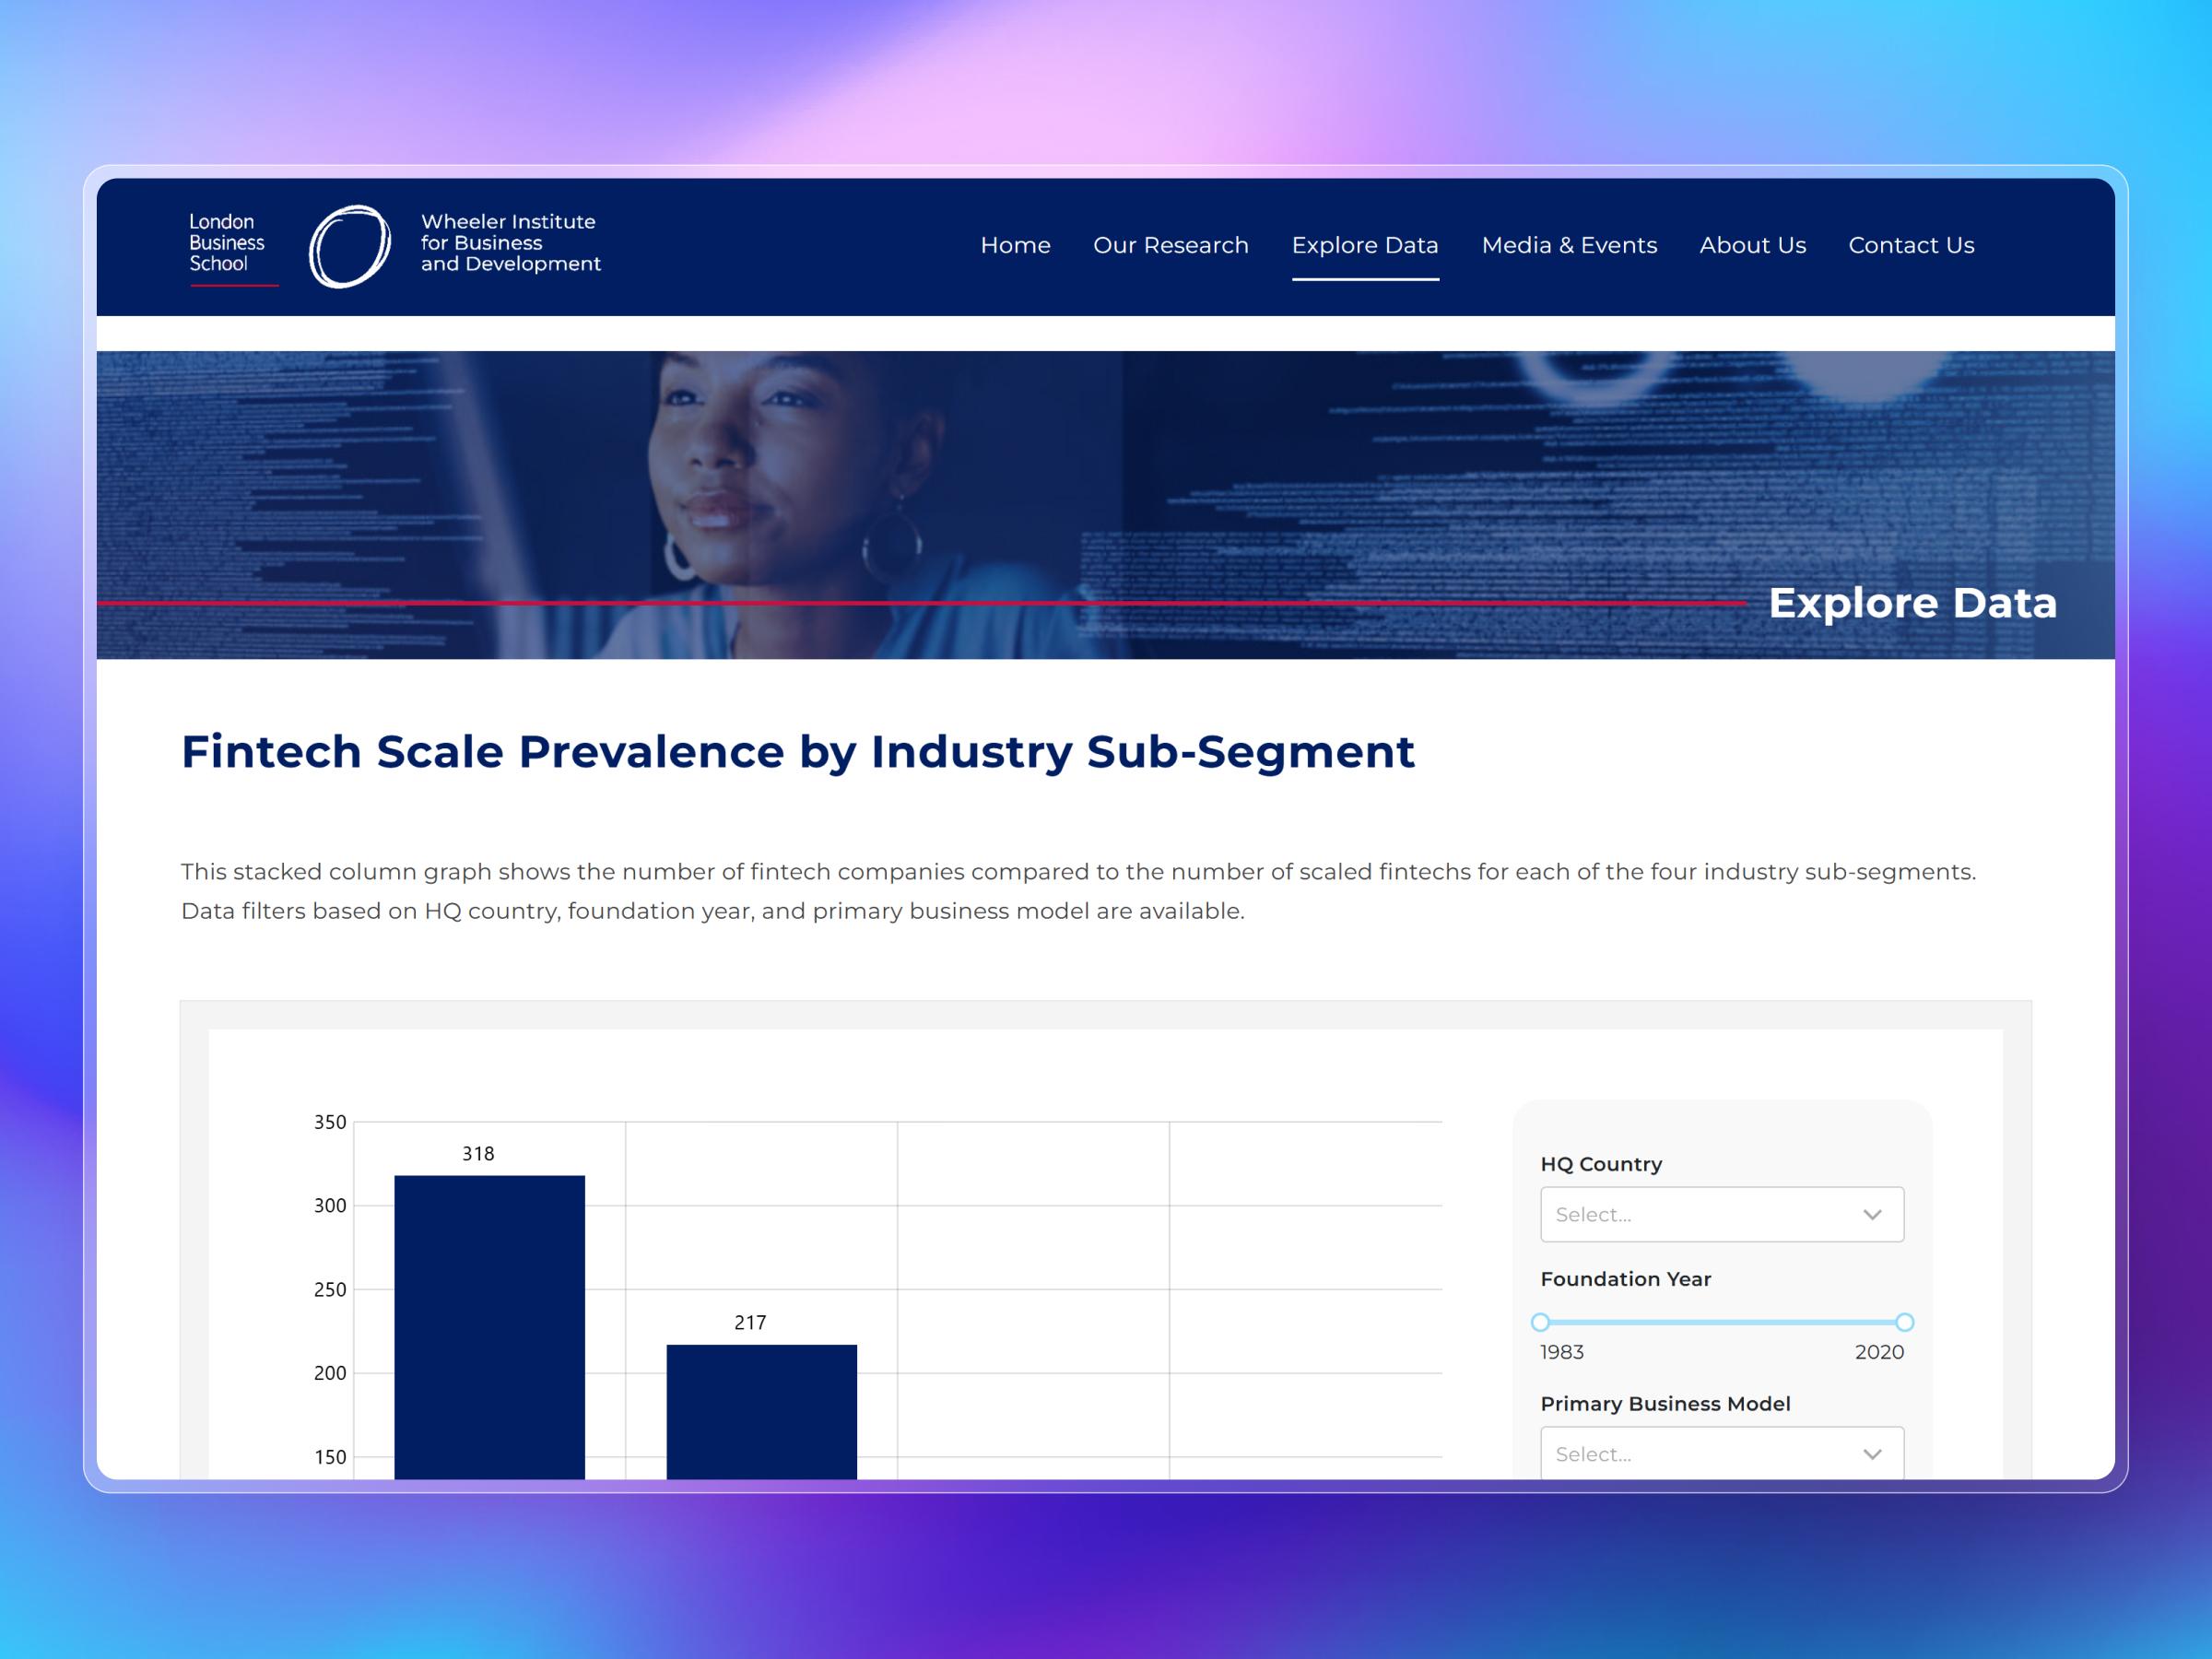
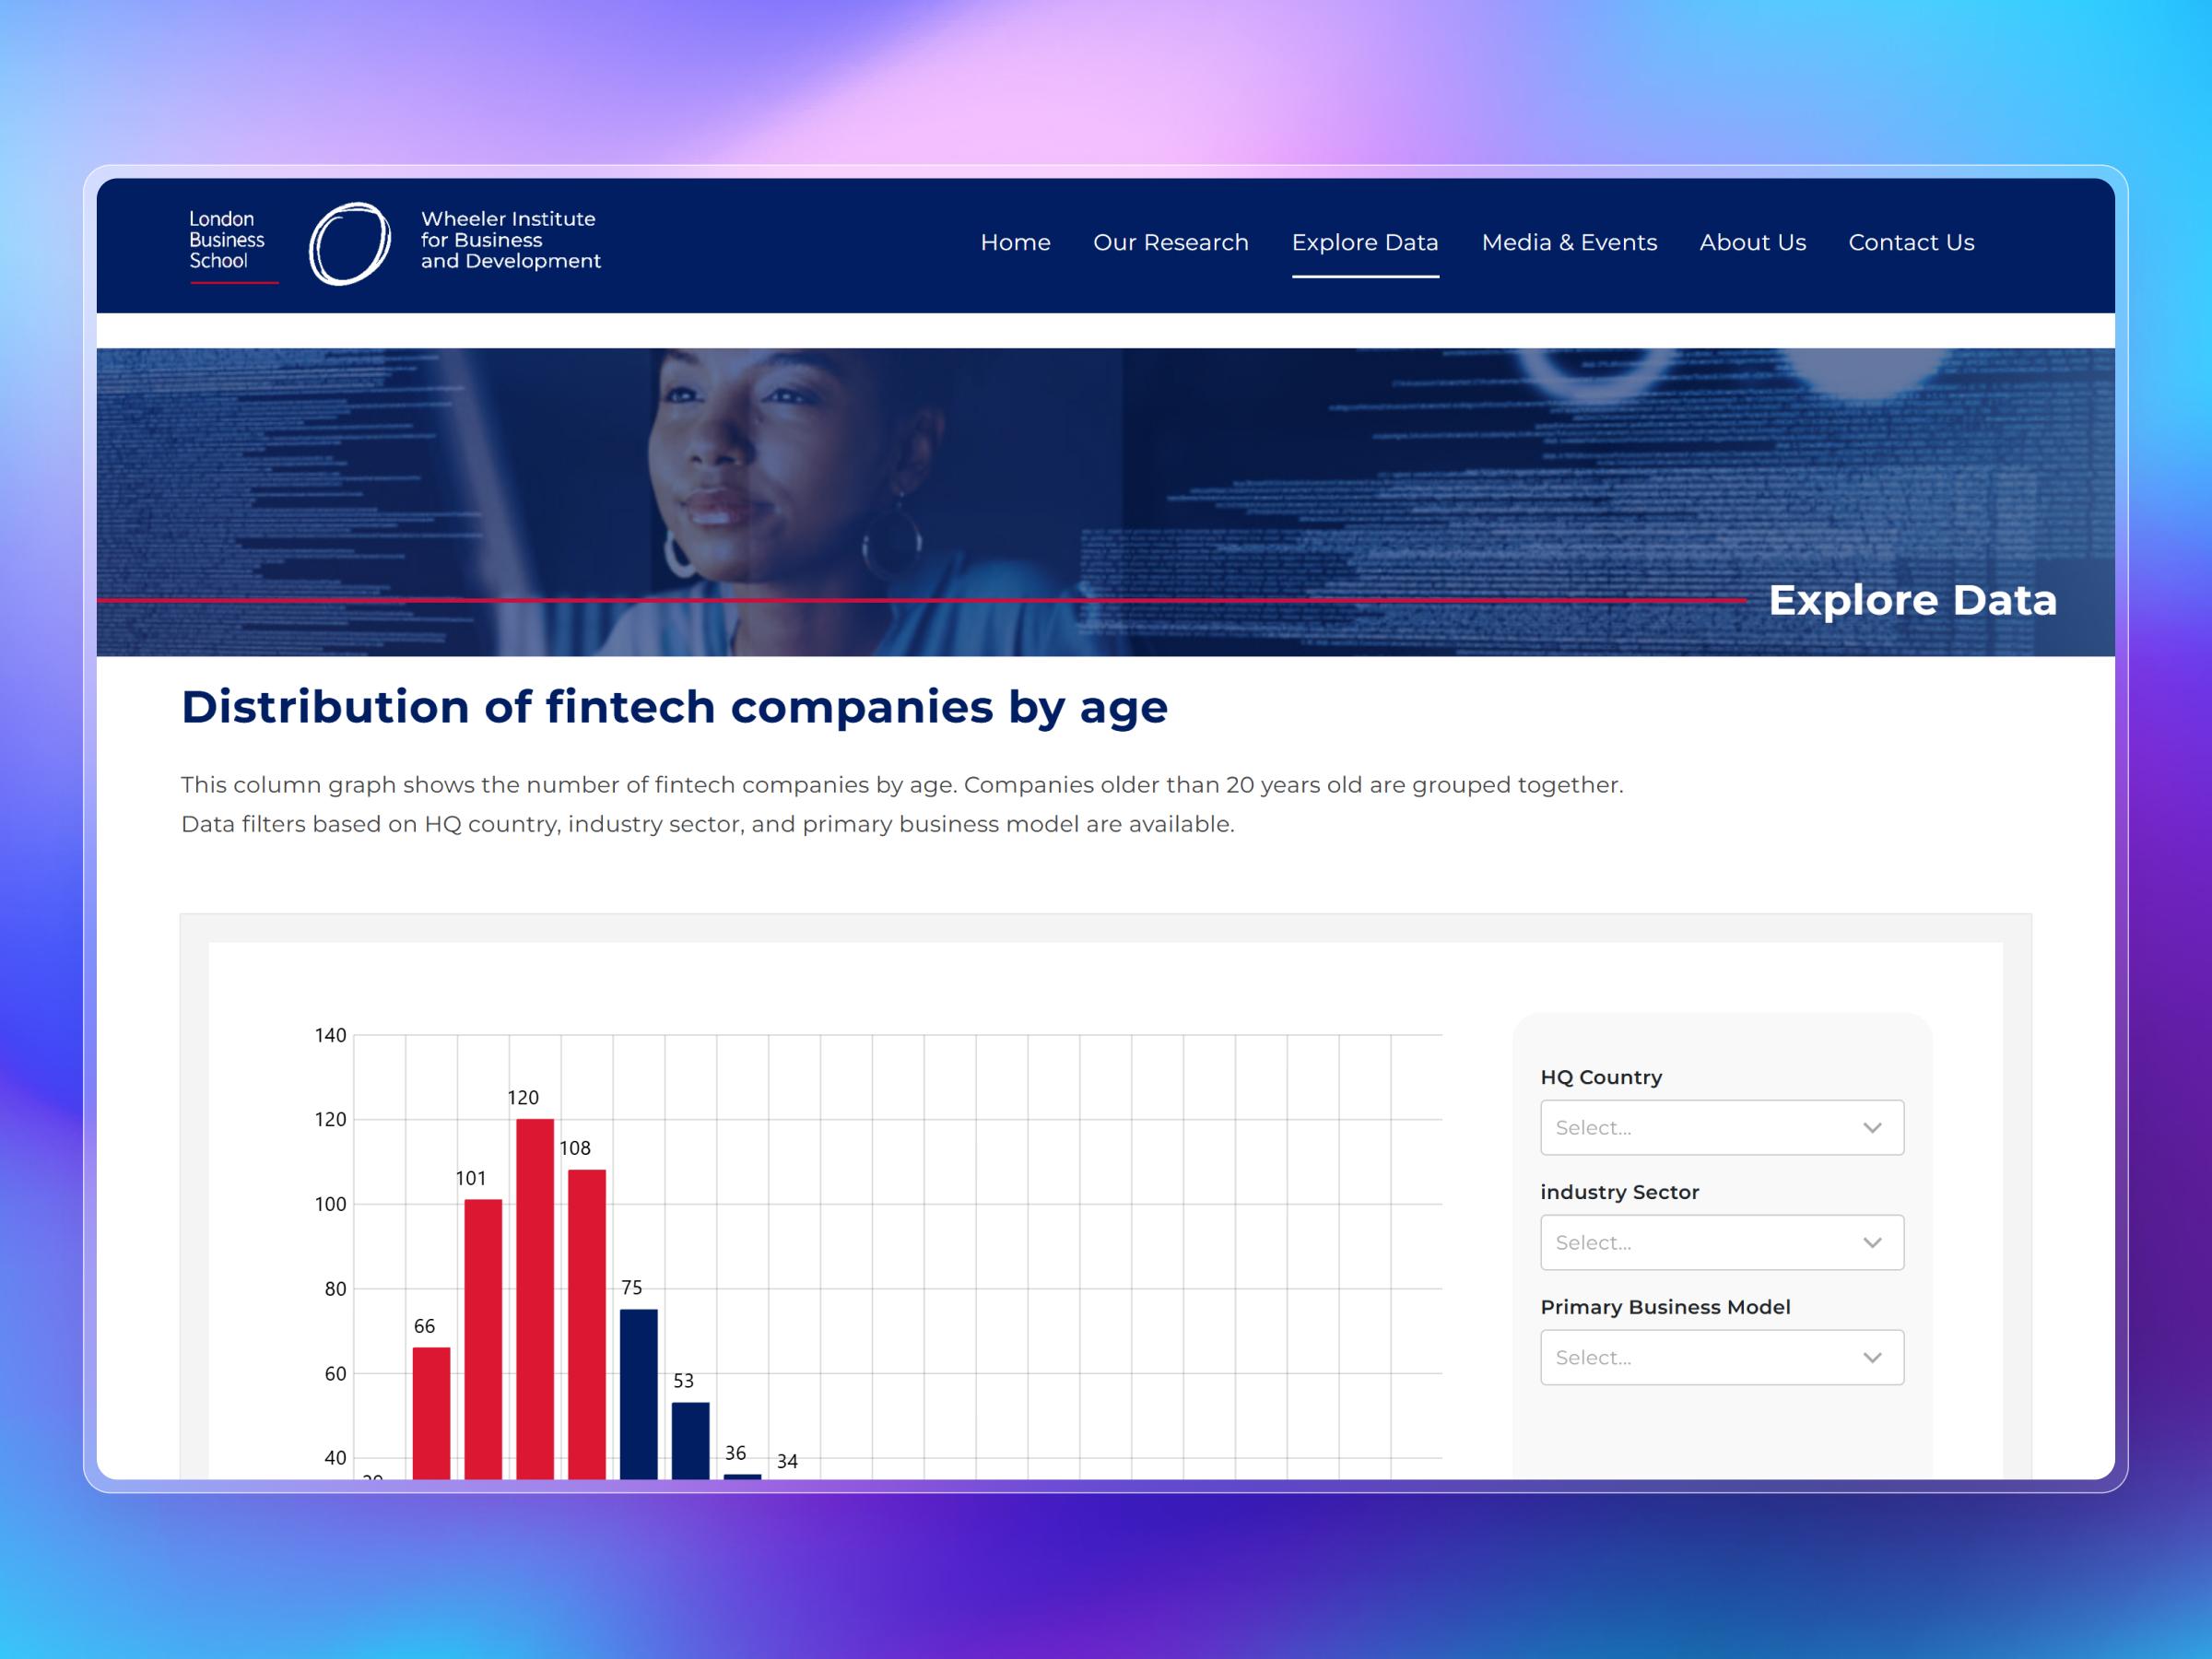
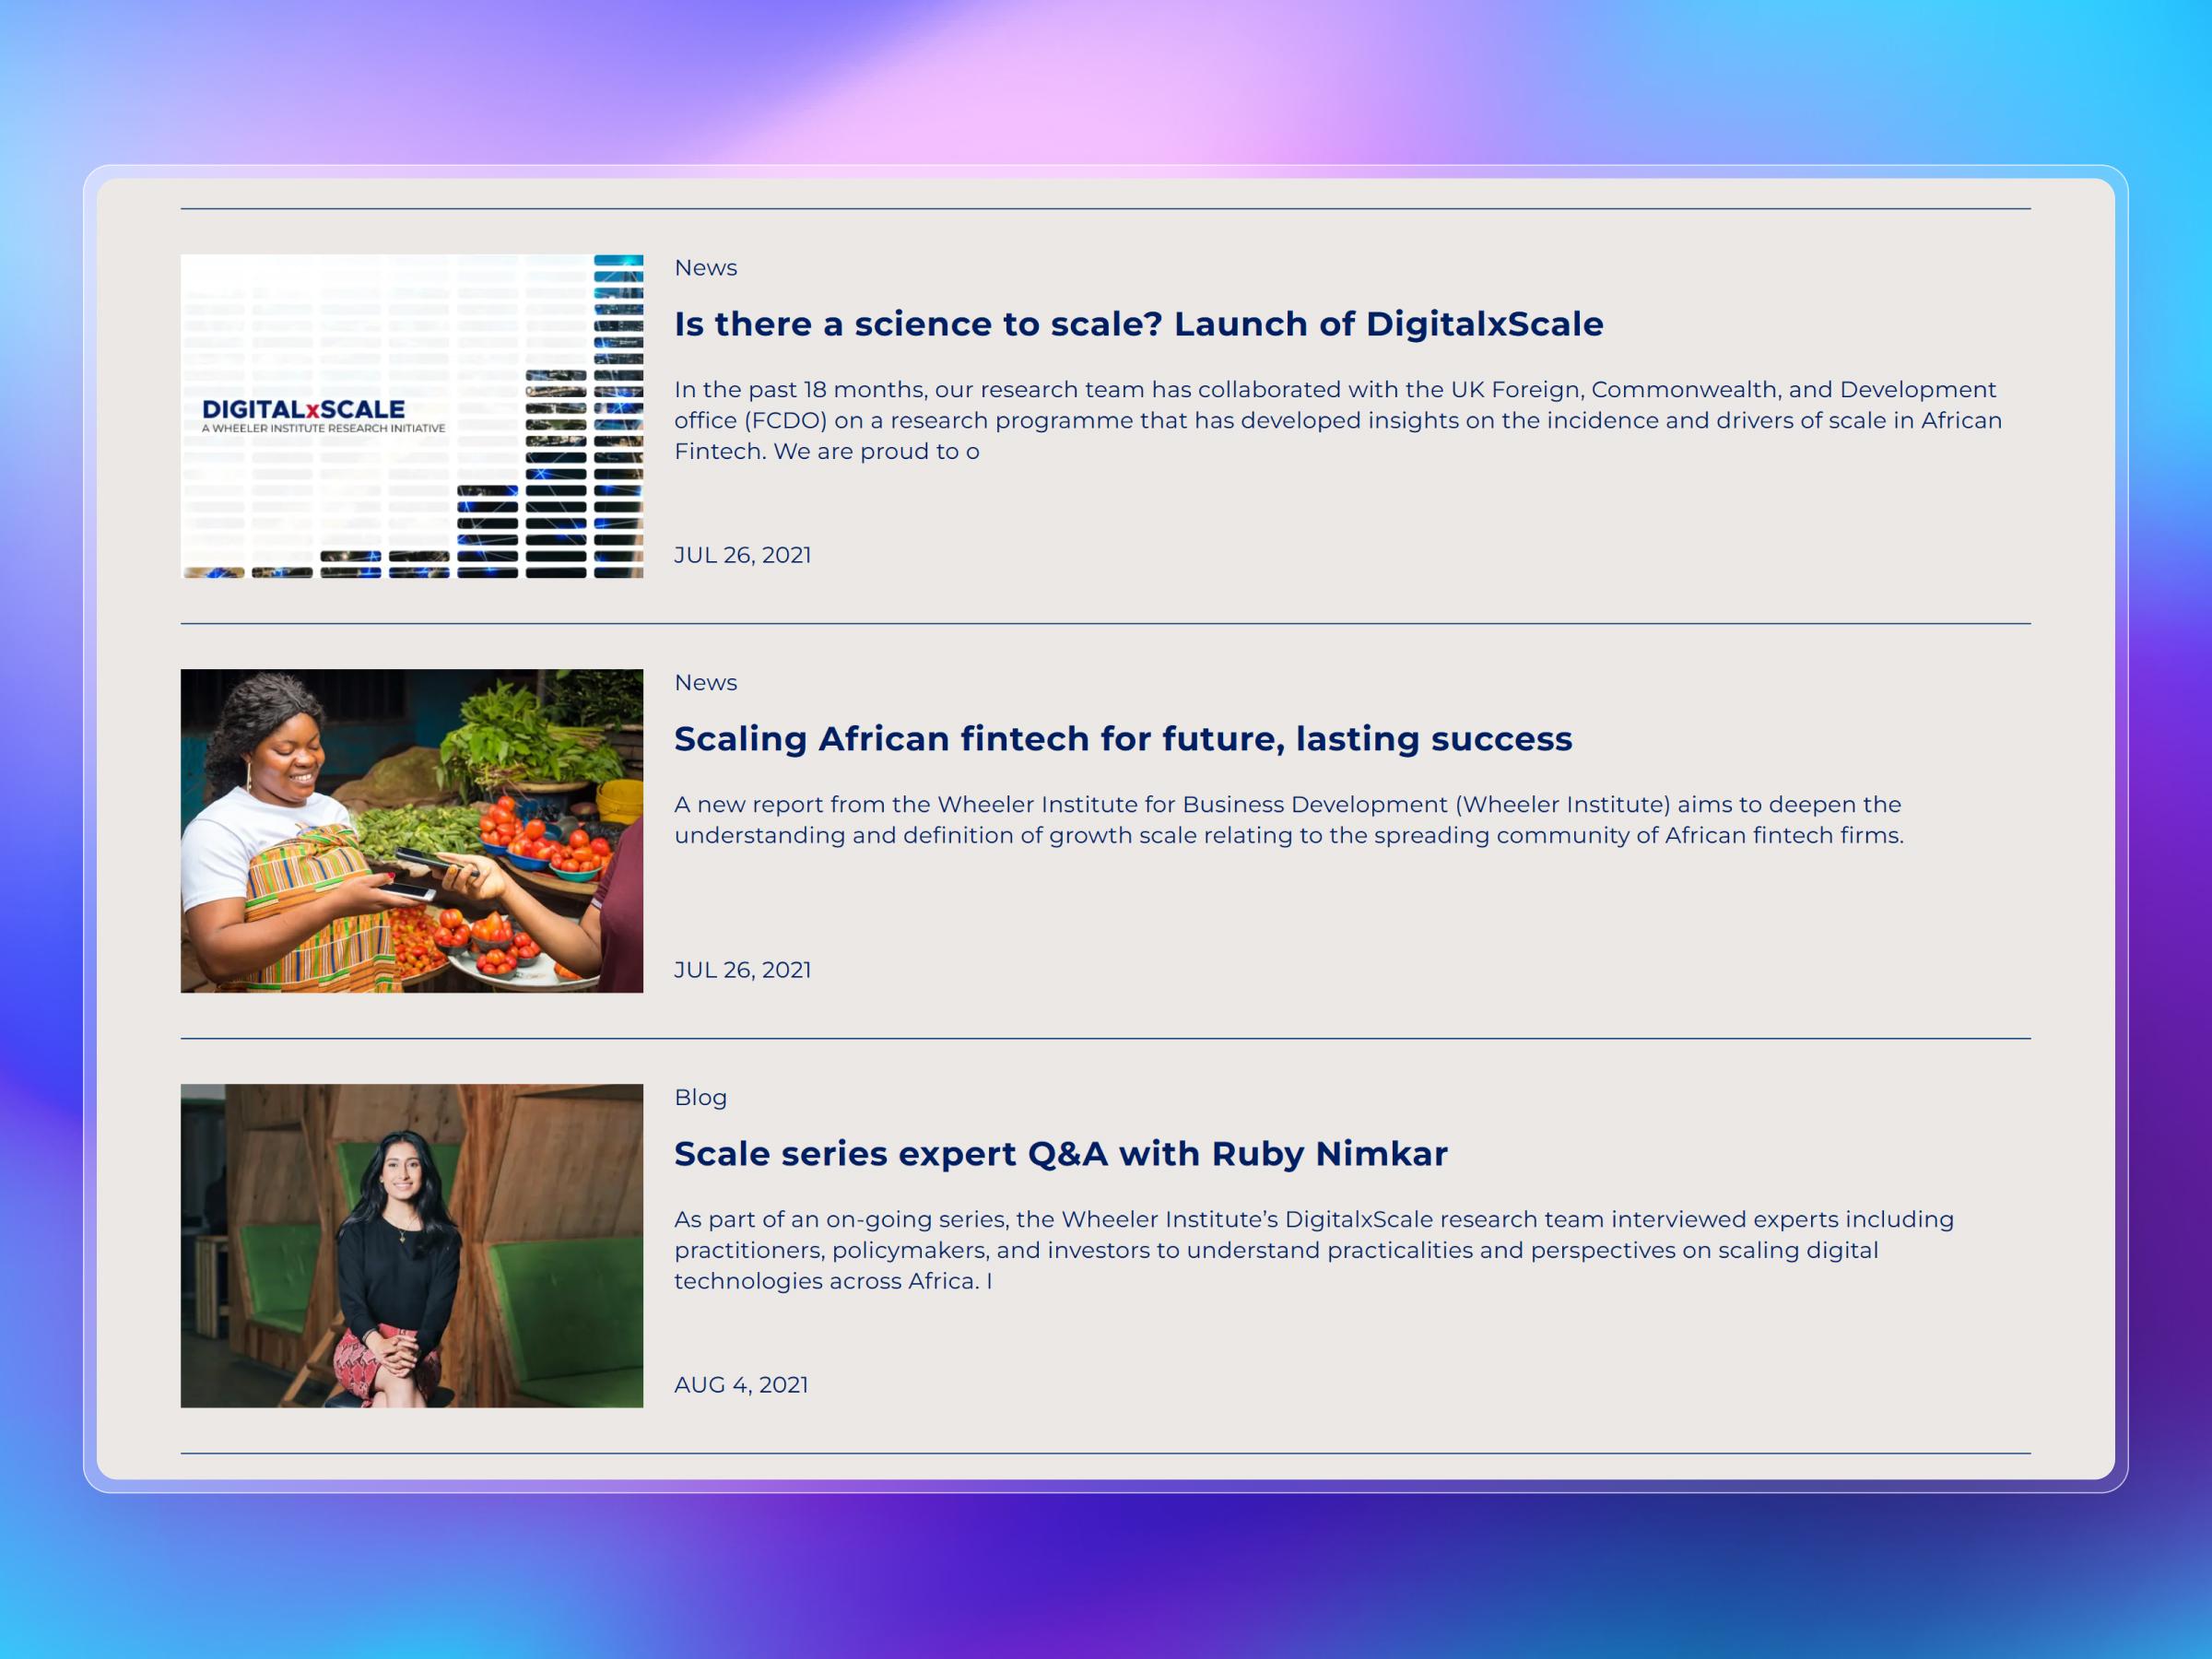
The DigitalXScale platform includes a tool we built specifically for this: a researcher uploads an Excel file to the CMS, selects the type of visualisation they want — bar chart, line chart, pie chart, map, and so on — and the platform parses the data and generates a publishable infographic. The entire process happens within the platform. No design software, no third-party tools, no developer involvement. For a research team working in Excel, it removes the gap between having data and publishing a visual that communicates it.

What tech stack is best for an academic data visualization platform?

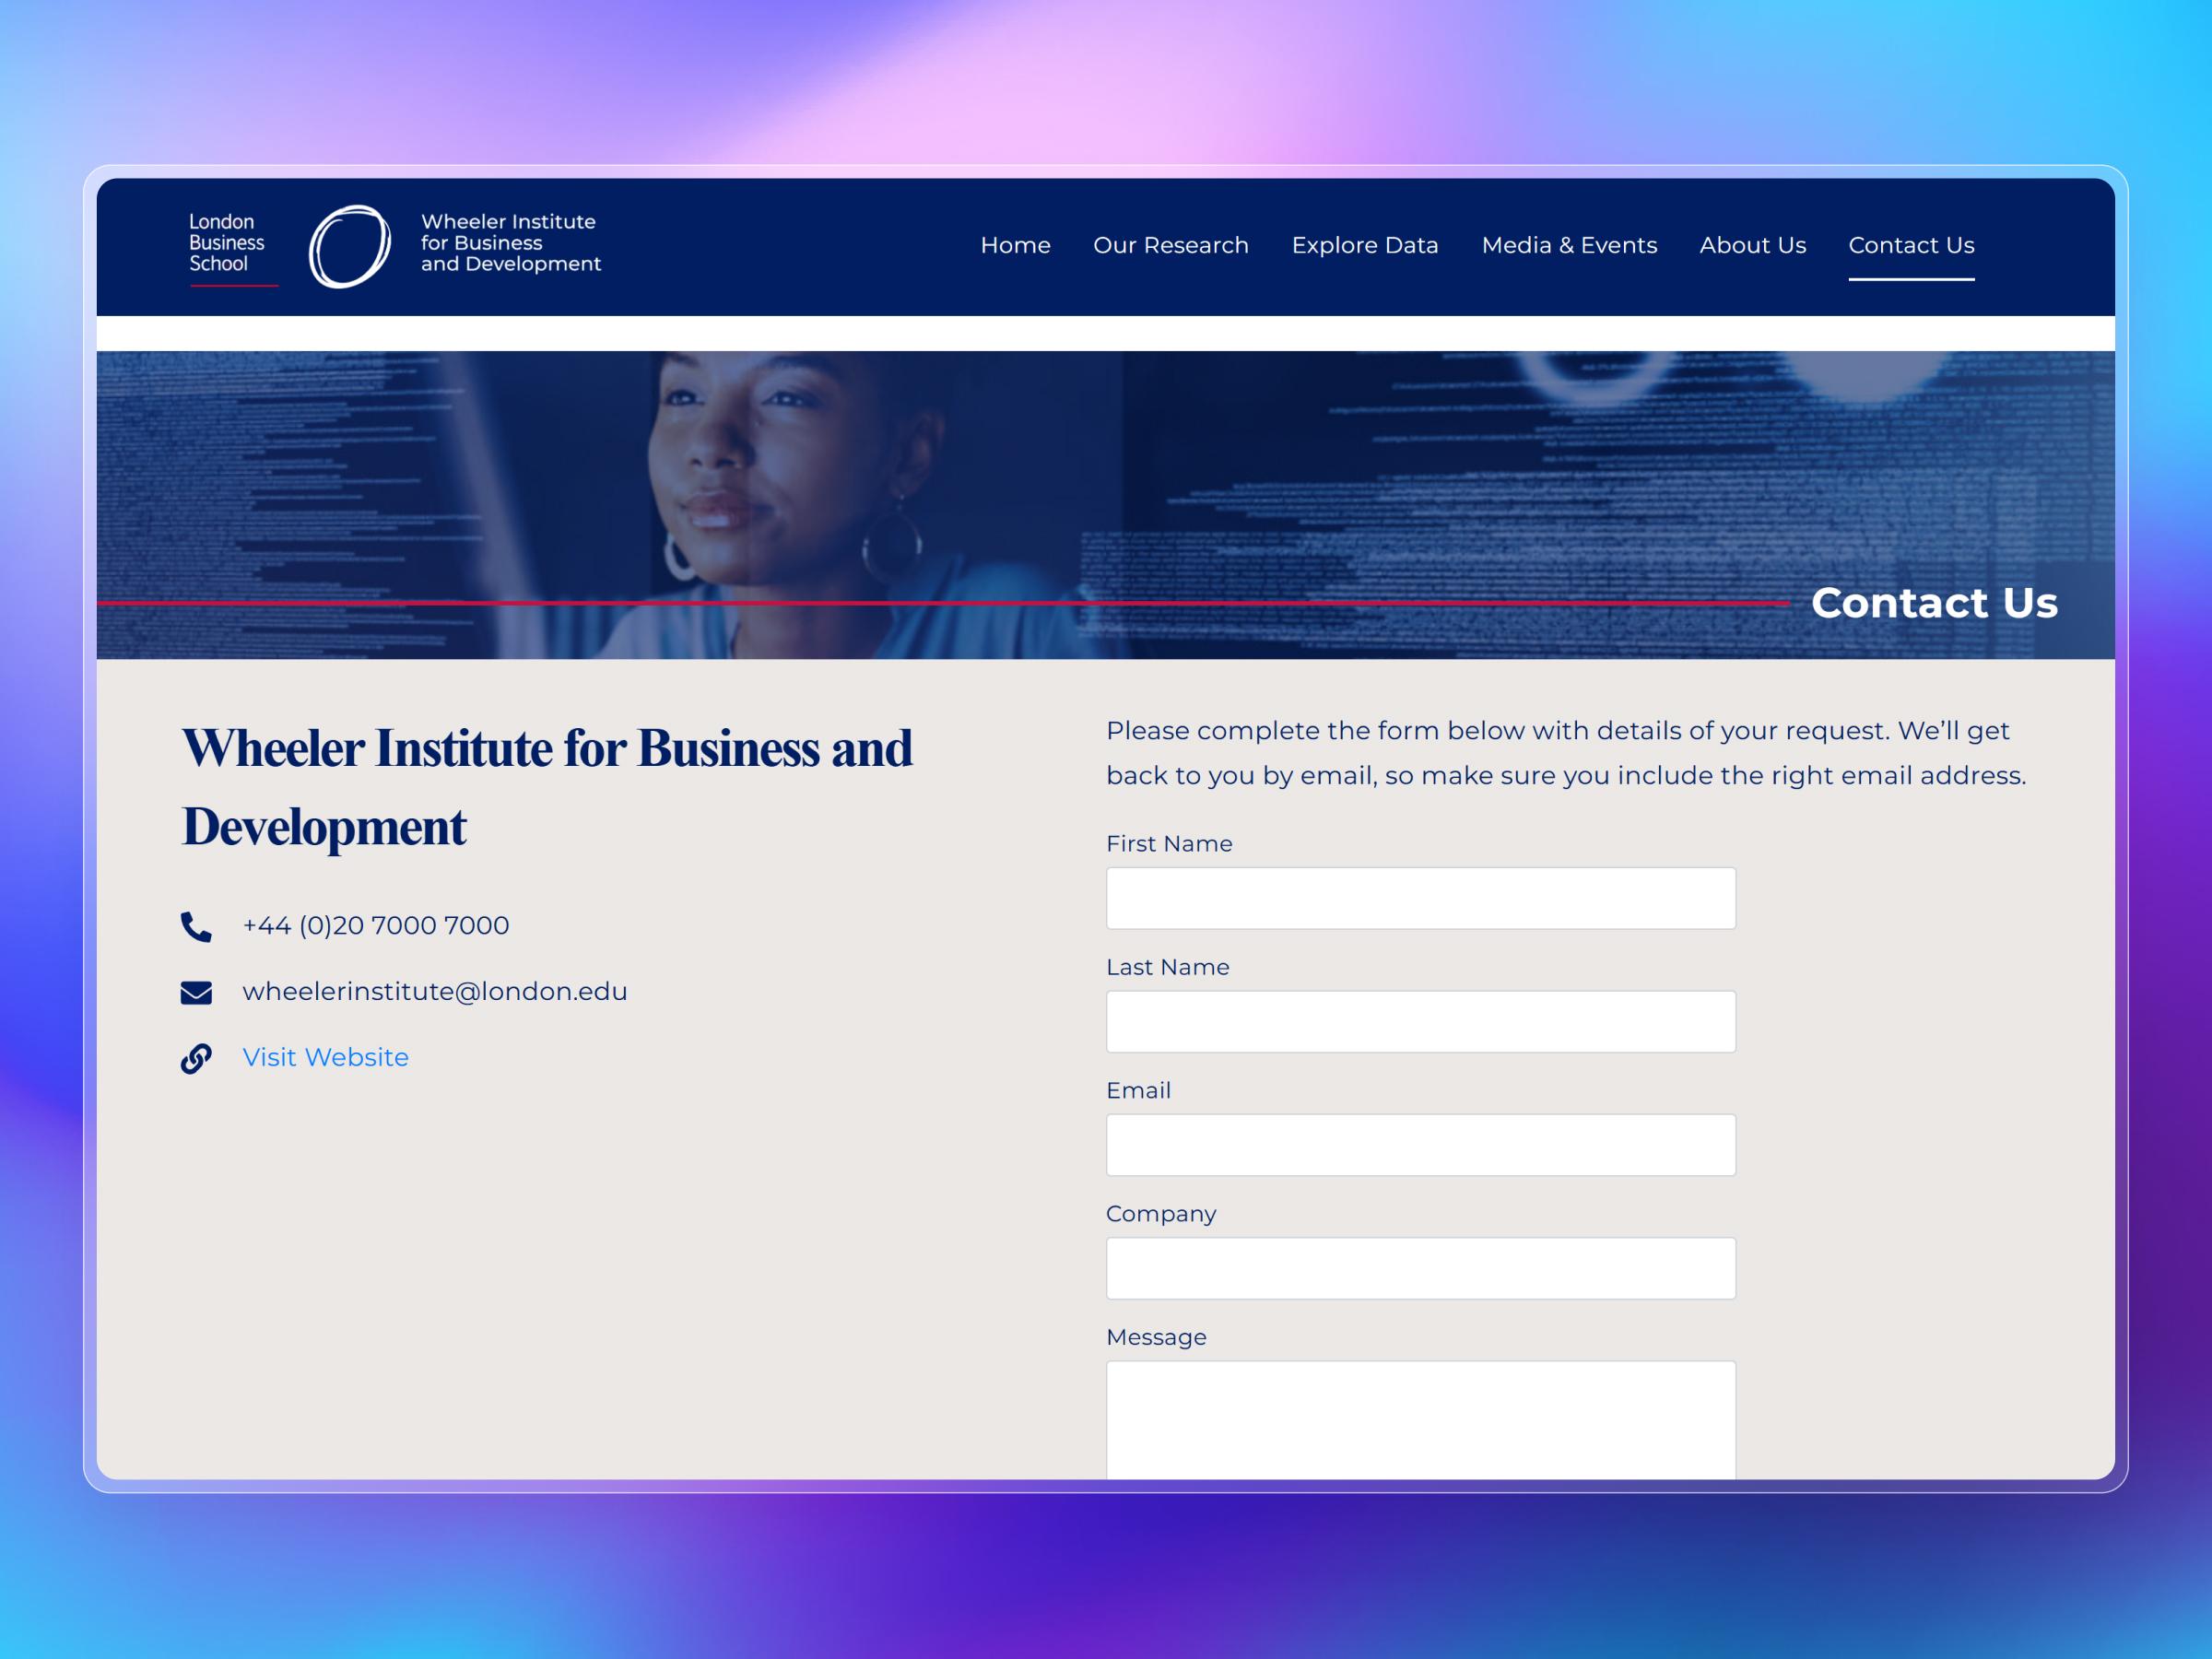
For DigitalXScale we used Next.js for the frontend, Node.js for the backend, and PostgreSQL as the database. Next.js handles server-side rendering which is important for a research platform that needs to be crawlable and fast. Node.js gives us the flexibility to build custom features like the Excel parser and chart generator. PostgreSQL handles the complex relational data model — research papers with multiple authors, institutions, topics, and linked datasets. This stack gives you performance, flexibility, and the ability to build features that off-the-shelf platforms can't provide.

Can an Indian web agency build a platform for a UK university?

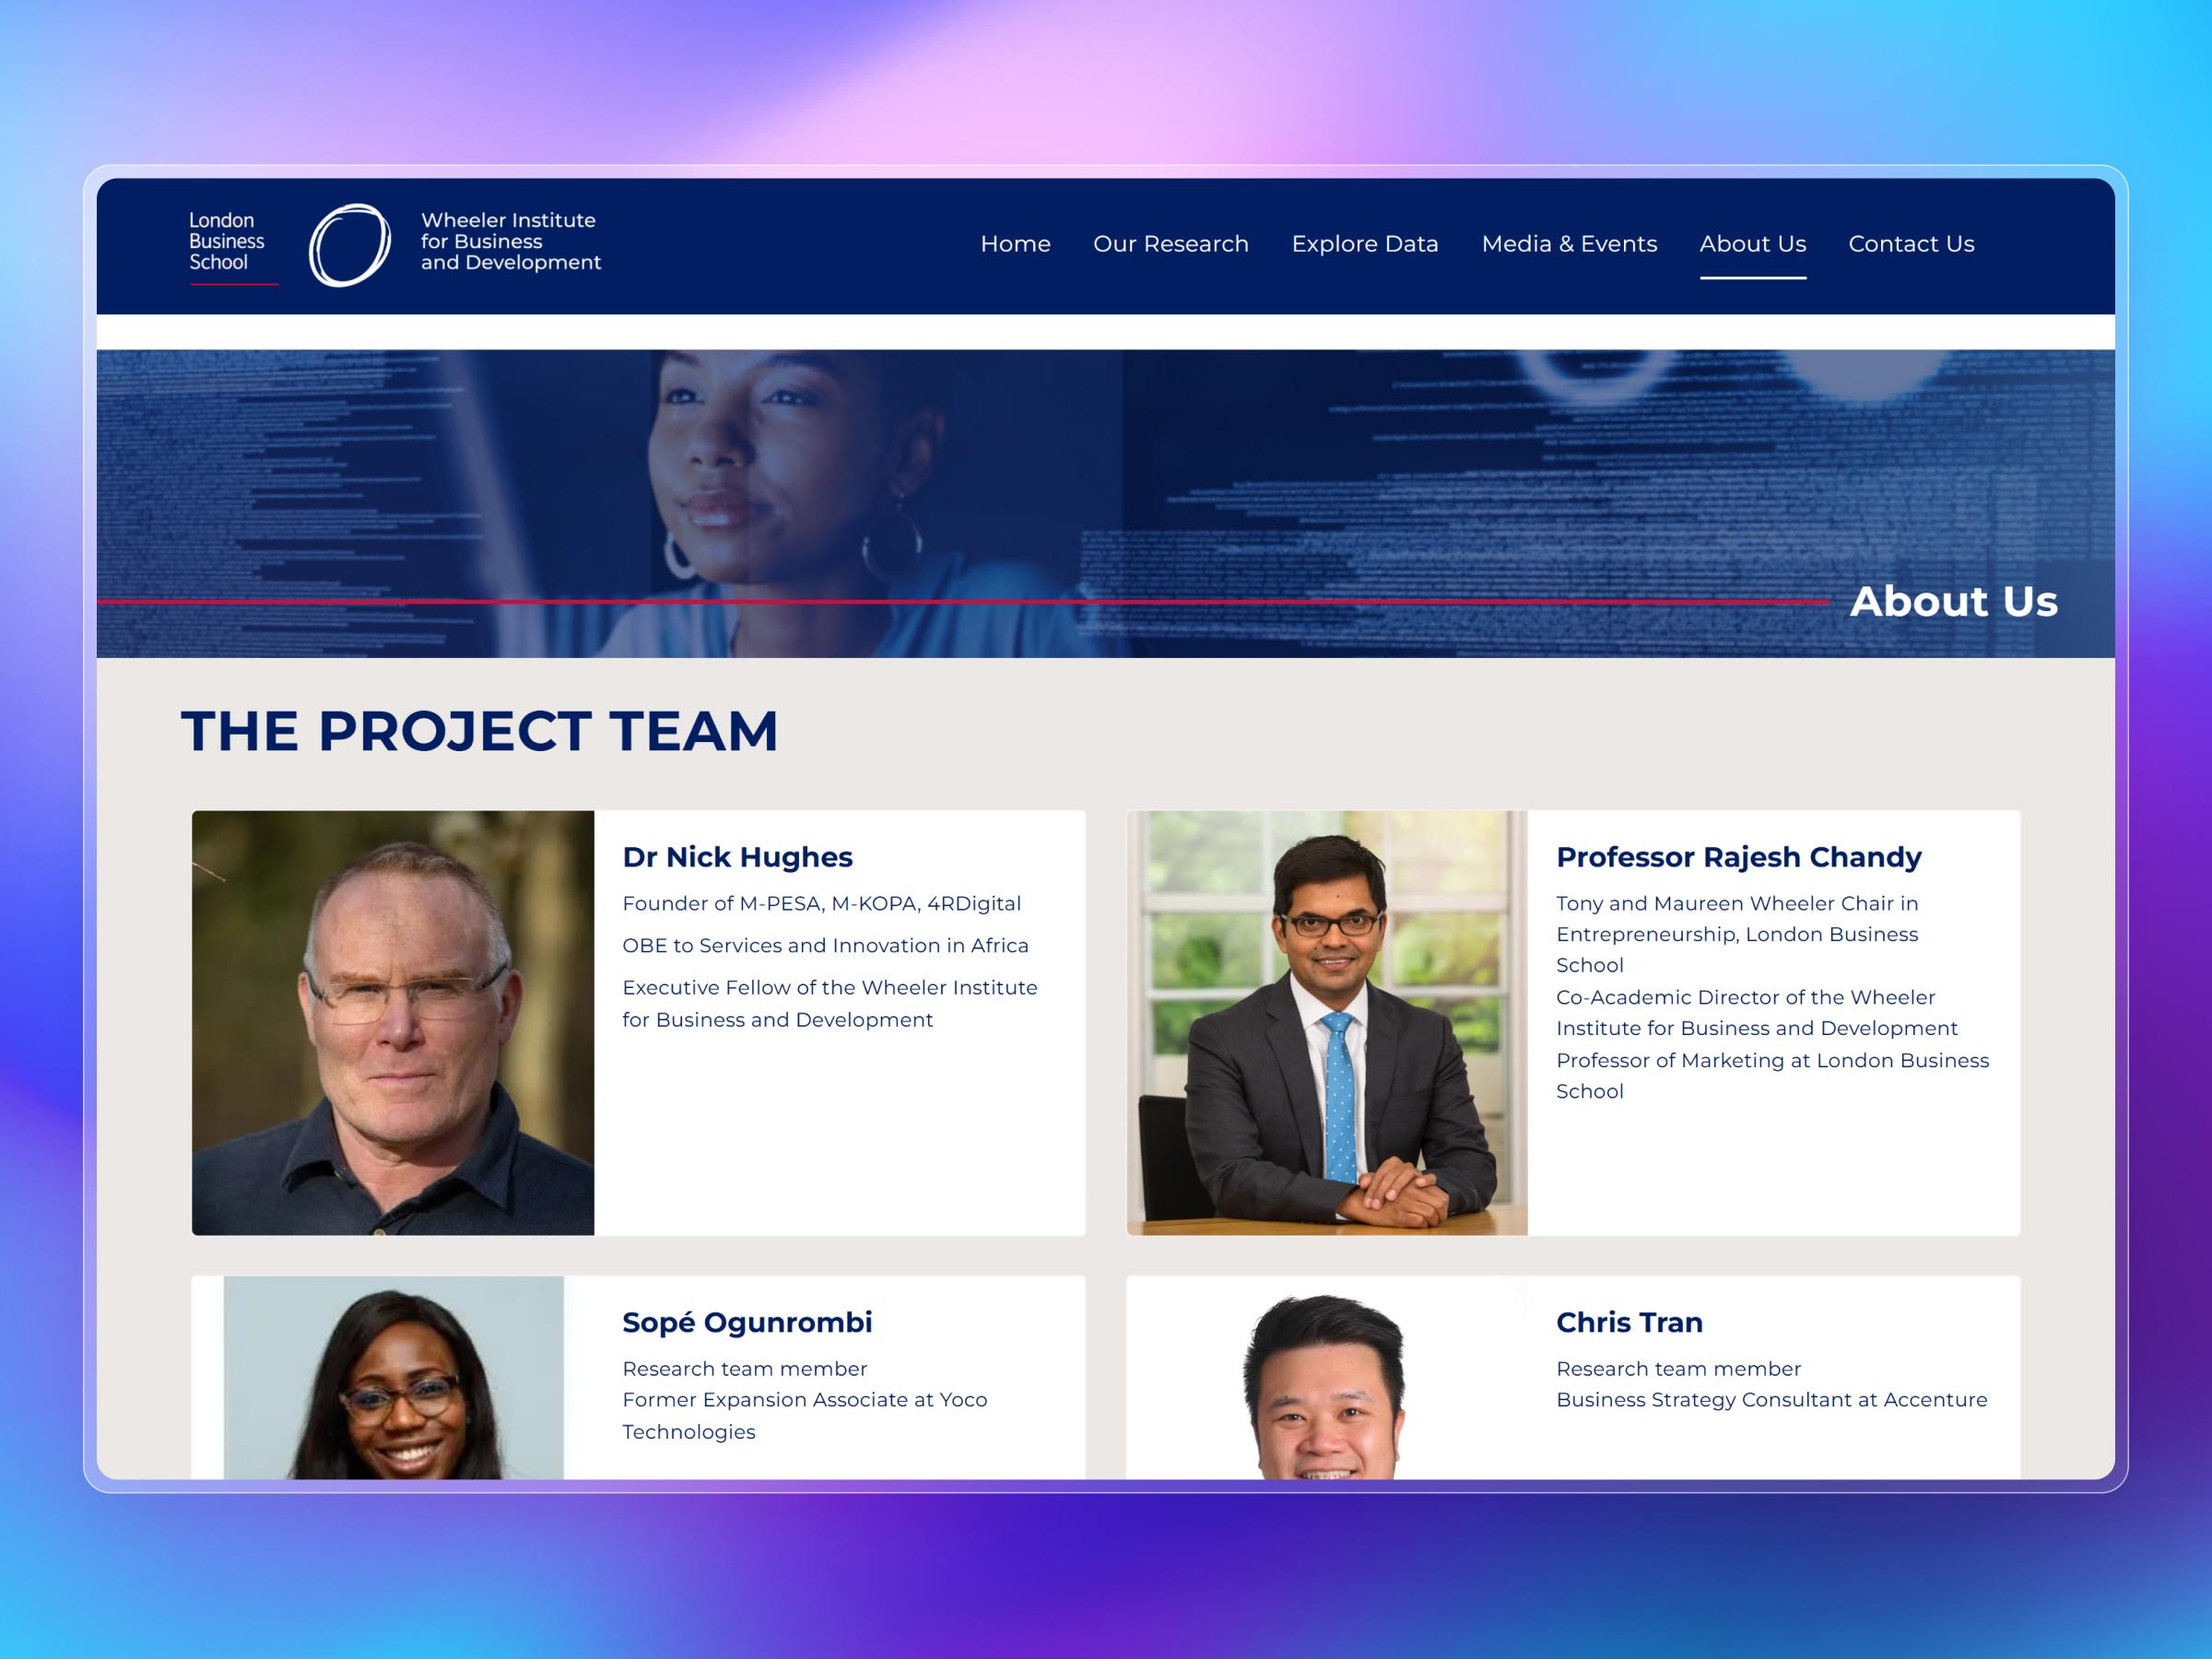
Yes — and it's increasingly common. Research institutions and universities in the UK and elsewhere work with offshore development teams regularly, particularly for custom platforms that require significant engineering work. For DigitalXScale, Craftnotion built the full platform — frontend, backend, custom CMS, and the Excel-to-infographic tool — for the Wheeler Institute at London Business School. The project required close collaboration on the content model and feature requirements, all handled remotely. What matters is the technical capability and the ability to understand the client's specific requirements — not geography.

Get in touch

Interested in something like DigitalXScale? Our team can help you build or improve your own project.